ajax loader

Loading...


Ride-the-Wave Strategy – Best for Stock Traders

Ride-the-Wave targets multi-day price momentum following a company’s earnings announcement (EA). With this strategy:

  1. Buy a stock one day post-EA if a stock reacts positively post-earnings:
    1. Near the close of trading the EA-day for a pre-market-EA
    2. Near the close of the following day for a post-market-EA
  2. Sell-to-close after 7-10 days, or possibly earlier if a desired price target is reached

Similarly,

  1. short a stock one day post-EA if a stock reacts negatively post-earnings:
    1. near the close of trading the EA-day for a premarket-EA
    2. near the close of the following day for a post-market-EA
  2. then buy-to-close after 7-10 days, or possibly earlier if a desired price target is reached

Important: Ride-the-Wave is predicated on significant price momentum triggered by an EA. The 7-10 day scenario is the maximum trade hold-time. If you see post EA-momentum is halted or reversed by a significant opposite move, re-evaluate your presence in the trade.

This popular StockEarnings screen below will give you a list of stocks that historically exhibit significant price momentum following an EA for the next seven days:

  1. Stocks exhibiting positive post-EA price moves are buy-candidates
  2. Stocks exhibiting negative post-EA price moves are sell/short-candidates

The screen includes those stocks whose Earnings just came out in last two days.

Screen criteria:

  1. Earnings Date Start Date : Current Date + -1 Day
  2. Earnings Date End Date : Current Date + -2 Days
  3. Predicted Move (Next Day) Max : 7%
  4. Predicted Move (On 7th Day) Min : 7%

Strategy Guideline:

  1. Buy the stock if stock has reacted positively. Short the stock if stock has reacted negatively (see above).
  2. Close the position in 7-10 days, or possibly earlier based on price move.

Volatility Crush Strategy - Best for Options Traders

The Volatility Crush strategy is used with stocks that typically experience relatively low-to-moderate price moves (≤4%) following their Earnings Announcements (EA). The basic trade idea is to sell put or call options right before the EA, collecting a credit when options premium is very high due to elevated implied volatility (IV). You then close the position right after the EA by buying the option back much cheaper due to the significant drop in IV that occurs after the mystery of the EA disappears. In assessing this trade, you need to do your homework to ensure you collect sufficient premium to make the trade worthwhile.

This trade is practical due to the low-to-moderate price-move after the EA, which generally won’t significantly affect the options price, unlike an “action” stock, which experience great price moves post-EA. With these symbols, if you’re on the right side of the price move, that’s a great thing. But if you’re on the wrong side of the move, not so great. Consequently, by minimizing the effect of the post-EA price move, you have a much better chance to profit from the reduction in IV without it being ruined by a violent price move.

For this trade, open the position either (1) the night before the EA when the company announces earnings or (2) during the EA day when it announces post-market, generally capturing IV at or close to its peak.

For this trade, open the position either (1) the night before the EA when the company announces earnings or (2) during the EA day when it announces post-market, generally capturing IV at or close to its peak.

This popular stockearnings screen will give you a list of stocks which do not react more than 4% fpost-EA. It includes only those stocks whose earnings are releasing next day.

Screen criteria:

  1. Earnings Date Start Date : Current Date + 1
  2. Earnings Date End Date : Current Date + 1
  3. Predicted Move (Next Day) Max : 4%
  4. Options Type: Weekly

Strategy Guideline:

  1. Options Strategy: Sell Call and Put
  2. Options Strike Price: Current Stock Price – (% Predicated Move x 2)
  3. Expiration Date: It should generally be the closest expiry immediately after the EA.
  4. Buy Insurance: Buying back Call and Put at Strike price which 10% lower than Sell Strike Price is optional but recommended.

Watch Video for More Detail

Volatility Rush Strategy - Best for Options Traders

The Volatility Rush takes advantage of increasing options premiums into earnings announcements (EA) caused by an anticipated rise in Implied Volatility (IV). With this strategy, Buy a Call and Put at-the-money (a long straddle) 2-3 weeks before the EA when IV is lower. Sell the position either (1) the night before the EA when the company announces earnings pre-market, or (2) during the EA day when it announces post-market, generally capturing IV at or close to its peak.

This popular screen will give you a list of stocks whose Options premiums tend to rise into Earnings. It includes only those stocks whose Earnings are at least two weeks away from today.

Screen criteria:

  1. Earnings Date Start Date : Current Date + 15 Days
  2. Earnings Date End Date : Current Date + 30 Days
  3. Predicted Move (Next Day) Min : 5%
  4. Options Type: Weekly or Monthly if that lines up with the two to three-week lead-time for entering the trade

Strategy Guideline:

  1. Buy a Straddle at or close to the money two to three weeks pre-EA.
  2. Sell the position either the night before the EA when the company announces earnings pre-market, or during the EA day when it announces post-market.
  3. Expiration date should generally be the closest expiry immediately after the EA.
  4. Straddle price should not be more 60% of predicted move.

Predicted Move (Volatility)

Similar to Implied Volatility in Options. Expected volatility % based on our Proprietary Volatility Predication Model. We are expecting that stock price will likely to reach % in either direction by the end of next trading session after Earnings are released and not necessarily the closing volatility %.

Why is it important?

    This indicator helps

  1. Knowing expected volatility in stocks after Earnings helps to decide trading stocks before Earnings Announcement.
  2. Taking Advantage of volatility collapse following Earnings Results by using Advance Options strategies such as Spread and Straddles.

Since Last Earnings

Change in share price since last Earnings release.

Why is it Important?

When share has gained more than 10% since it's last Earning release, it tends to over react to minor bad news and give up some gains if not all. So, it contains more downside volatility than upside When share has dropped more than 10% since it's last Earning release, it tends to over react to minor good news and recover some drops if not all. So, it contains more upside volatility than downside.

EPS Surprise (%)

Occurs when a company's reported quarterly or annual profits are above or below analysts' expectations. Here is the formula to derive % EPS Surprice:

Actual EPS - Estimated EPS
------------------------------------- x 100
Estimated EPS

Why is it Important?

Earnings surprises can have a huge impact on a company's stock price. Several studies suggest that positive earnings surprises not only lead to an immediate hike in a stock's price, but also to a gradual increase over time. Hence, it's not surprising that some companies are known for routinely beating earning projections. A negative earnings surprise will usually result in a decline in share price.

Next Day Price Change (%)

Next Regular trading session Closing price following Earnings result.

For After Market Close Earnings, It is a next trading day closing price. For Before Market Open Earnings, It is the same trading day closing price.

Why is it Important?

Next Day price change is a reaction of Earnings result.

A Record Quarter… Or Did JPMorgan’s One-Off Gains Flatter The Result?

Posted on Jul 14, 2026 by Grayson Cavern

A Record Quarter… Or Did JPMorgan’s One-Off Gains Flatter The Result?

The obvious story from JPMorgan Chase and co (NYSE: JPM) second-quarter earnings is that the bank earned a record $21.2 billion, or $7.70 per share. That’s probably the number that led you here.

Now strip those gains away and JPMorgan still earned $16.9 billion, or $6.14 per share. That’s a quarter most banks would happily celebrate. Yet while everyone else was debating whether the one-off gains inflated earnings, I found myself curious about whether the business underneath those earnings had become stronger…or not.

Bigger Impact Than The Visa Gain 


One-off gains naturally dominate earnings headlines because they’re unusual. The problem is they’re also temporary. What tells you far more about a company is whether its core businesses are moving in the same direction, just as it happened this quarter

Consumer & Community Banking delivered another record quarter as card sales volume climbed 10%, loans increased 6%, and average deposits rose 3%. Commercial & Investment Banking wasn’t far behind. Investment banking fees jumped 30%, Markets revenue climbed 35%, while Equity Markets revenue surged an astonishing 86%. Even Asset & Wealth Management continued its remarkable run, ending the quarter with a record $5.1 trillion under management and $6.4 trillion in client assets. In other words, the Visa gain only explains why earnings looked extraordinary. It doesn’t explain why almost every major business inside JPMorgan reached another record.

That’s probably why one line from Jamie Dimon stood out more than the EPS figure itself. “Revenue in each line of business reached a record.” 

More Than Just A Traditional Bank

The more I looked at those segment results, the less JPMorgan resembled what most people think of as a bank. Banks traditionally compete for deposits, make loans and earn interest income.

Yeah, JPMorgan still does all of that. But the same company now helps consumers manage their money, finances businesses, advises corporations on mergers, underwrites IPOs, processes payments across the world, manages trillions of dollars for investors and operates one of the largest trading businesses on the planet. Even better, these businesses feed one another.

A corporate client that raises capital today could become a treasury services customer tomorrow. That relationship might eventually create opportunities in payments, investment management or commercial banking. The larger the network becomes, the easier it becomes to deepen existing relationships instead of constantly searching for new ones.

At this point, scale stops being a statistic and starts becoming a moat.

That idea isn’t unique to JPMorgan Chase and co (NYSE: JPM). Look at Switzerland.

Following UBS’s acquisition of Credit Suisse, regulators became increasingly concerned that the combined institution had grown so large relative to the Swiss economy that its failure could threaten the country’s financial system. The conversation stopped being about market share and started becoming about infrastructure.

I’m not suggesting JPMorgan has reached that point in the United States. The American financial system is far larger and far more diversified.

But I do think the direction feels familiar. Every quarter, the company becomes a little more embedded in the financial system and a little harder for competitors to replicate.

Jamie Dimon Still Sees The Risks I Wrote About Last Quarter.

One thing hasn’t changed, Jamie Dimon still isn’t behaving like someone who believes the economy is out of danger.

Even after delivering one of the strongest quarters in JPMorgan’s history, he returned to the same themes that have defined his outlook for well over a year: geopolitical tensions, persistent inflation, elevated asset prices and growing fiscal deficits. Yes, he acknowledged that the U.S. economy has remained resilient. He also made it clear that resilience shouldn’t be mistaken for certainty. 

If you read my first-quarter breakdown a few months ago, that won’t come as much of a surprise. I argued then that JPMorgan wasn’t thriving because uncertainty had disappeared, it was thriving despite it. This quarter reinforces that view. Even after delivering record results, Dimon is still preparing the bank for a world he believes remains unusually fragile.

I think that’s an underrated strength because companies often become overconfident after record quarters. Dimon seems to have become more disciplined.

What Does The Technical Picture Look Like?

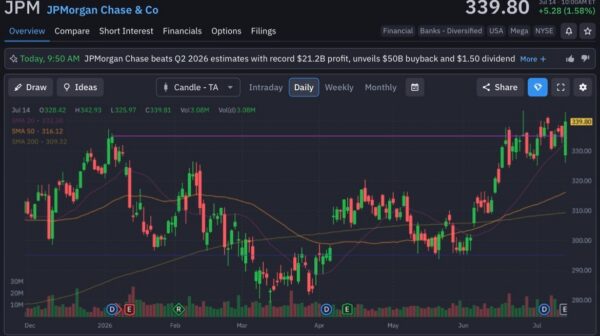
The technical picture complements the fundamentals rather well.

JPMorgan continues trading above its 20-day, 50-day and 200-day moving averages, keeping both the short- and long-term uptrends firmly intact. More importantly, the stock has held above its breakout near $333 instead of giving those gains back. A sign buyers remain committed rather than simply reacting to an earnings headline. Trading volume of roughly 3.08 million shares was healthy without showing signs of speculative excess, while the absence of heavy selling suggests institutions are still accumulating shares even with the stock sitting near all-time highs. For a company this large, that’s usually a constructive signal.
jpmorgan-StockEarnings

The Bigger Story May Just Be Beginning.

I’m afraid the $21.2 billion profit will dominate the headlines because it’s easy to remember. Not me. What I’ll remember is that almost every major business inside JPMorgan reached another record at the same time.

That’s much harder to fake than a one-off accounting gain. The Visa transaction made a great quarter look even greater. The operating business suggests something much more durable is happening.

And if that trend continues, I’d stop looking at JPMorgan as simply America’s largest bank. But as one of the world’s most important financial platforms.


Join over 1.2M+ investors/traders who receive daily and weekly notable earnings alerts with predicted move