ajax loader

Loading...


Ride-the-Wave Strategy – Best for Stock Traders

Ride-the-Wave targets multi-day price momentum following a company’s earnings announcement (EA). With this strategy:

  1. Buy a stock one day post-EA if a stock reacts positively post-earnings:
    1. Near the close of trading the EA-day for a pre-market-EA
    2. Near the close of the following day for a post-market-EA
  2. Sell-to-close after 7-10 days, or possibly earlier if a desired price target is reached

Similarly,

  1. short a stock one day post-EA if a stock reacts negatively post-earnings:
    1. near the close of trading the EA-day for a premarket-EA
    2. near the close of the following day for a post-market-EA
  2. then buy-to-close after 7-10 days, or possibly earlier if a desired price target is reached

Important: Ride-the-Wave is predicated on significant price momentum triggered by an EA. The 7-10 day scenario is the maximum trade hold-time. If you see post EA-momentum is halted or reversed by a significant opposite move, re-evaluate your presence in the trade.

This popular StockEarnings screen below will give you a list of stocks that historically exhibit significant price momentum following an EA for the next seven days:

  1. Stocks exhibiting positive post-EA price moves are buy-candidates
  2. Stocks exhibiting negative post-EA price moves are sell/short-candidates

The screen includes those stocks whose Earnings just came out in last two days.

Screen criteria:

  1. Earnings Date Start Date : Current Date + -1 Day
  2. Earnings Date End Date : Current Date + -2 Days
  3. Predicted Move (Next Day) Max : 7%
  4. Predicted Move (On 7th Day) Min : 7%

Strategy Guideline:

  1. Buy the stock if stock has reacted positively. Short the stock if stock has reacted negatively (see above).
  2. Close the position in 7-10 days, or possibly earlier based on price move.

Volatility Crush Strategy - Best for Options Traders

The Volatility Crush strategy is used with stocks that typically experience relatively low-to-moderate price moves (≤4%) following their Earnings Announcements (EA). The basic trade idea is to sell put or call options right before the EA, collecting a credit when options premium is very high due to elevated implied volatility (IV). You then close the position right after the EA by buying the option back much cheaper due to the significant drop in IV that occurs after the mystery of the EA disappears. In assessing this trade, you need to do your homework to ensure you collect sufficient premium to make the trade worthwhile.

This trade is practical due to the low-to-moderate price-move after the EA, which generally won’t significantly affect the options price, unlike an “action” stock, which experience great price moves post-EA. With these symbols, if you’re on the right side of the price move, that’s a great thing. But if you’re on the wrong side of the move, not so great. Consequently, by minimizing the effect of the post-EA price move, you have a much better chance to profit from the reduction in IV without it being ruined by a violent price move.

For this trade, open the position either (1) the night before the EA when the company announces earnings or (2) during the EA day when it announces post-market, generally capturing IV at or close to its peak.

For this trade, open the position either (1) the night before the EA when the company announces earnings or (2) during the EA day when it announces post-market, generally capturing IV at or close to its peak.

This popular stockearnings screen will give you a list of stocks which do not react more than 4% fpost-EA. It includes only those stocks whose earnings are releasing next day.

Screen criteria:

  1. Earnings Date Start Date : Current Date + 1
  2. Earnings Date End Date : Current Date + 1
  3. Predicted Move (Next Day) Max : 4%
  4. Options Type: Weekly

Strategy Guideline:

  1. Options Strategy: Sell Call and Put
  2. Options Strike Price: Current Stock Price – (% Predicated Move x 2)
  3. Expiration Date: It should generally be the closest expiry immediately after the EA.
  4. Buy Insurance: Buying back Call and Put at Strike price which 10% lower than Sell Strike Price is optional but recommended.

Watch Video for More Detail

Volatility Rush Strategy - Best for Options Traders

The Volatility Rush takes advantage of increasing options premiums into earnings announcements (EA) caused by an anticipated rise in Implied Volatility (IV). With this strategy, Buy a Call and Put at-the-money (a long straddle) 2-3 weeks before the EA when IV is lower. Sell the position either (1) the night before the EA when the company announces earnings pre-market, or (2) during the EA day when it announces post-market, generally capturing IV at or close to its peak.

This popular screen will give you a list of stocks whose Options premiums tend to rise into Earnings. It includes only those stocks whose Earnings are at least two weeks away from today.

Screen criteria:

  1. Earnings Date Start Date : Current Date + 15 Days
  2. Earnings Date End Date : Current Date + 30 Days
  3. Predicted Move (Next Day) Min : 5%
  4. Options Type: Weekly or Monthly if that lines up with the two to three-week lead-time for entering the trade

Strategy Guideline:

  1. Buy a Straddle at or close to the money two to three weeks pre-EA.
  2. Sell the position either the night before the EA when the company announces earnings pre-market, or during the EA day when it announces post-market.
  3. Expiration date should generally be the closest expiry immediately after the EA.
  4. Straddle price should not be more 60% of predicted move.

Predicted Move (Volatility)

Similar to Implied Volatility in Options. Expected volatility % based on our Proprietary Volatility Predication Model. We are expecting that stock price will likely to reach % in either direction by the end of next trading session after Earnings are released and not necessarily the closing volatility %.

Why is it important?

    This indicator helps

  1. Knowing expected volatility in stocks after Earnings helps to decide trading stocks before Earnings Announcement.
  2. Taking Advantage of volatility collapse following Earnings Results by using Advance Options strategies such as Spread and Straddles.

Since Last Earnings

Change in share price since last Earnings release.

Why is it Important?

When share has gained more than 10% since it's last Earning release, it tends to over react to minor bad news and give up some gains if not all. So, it contains more downside volatility than upside When share has dropped more than 10% since it's last Earning release, it tends to over react to minor good news and recover some drops if not all. So, it contains more upside volatility than downside.

EPS Surprise (%)

Occurs when a company's reported quarterly or annual profits are above or below analysts' expectations. Here is the formula to derive % EPS Surprice:

Actual EPS - Estimated EPS
------------------------------------- x 100
Estimated EPS

Why is it Important?

Earnings surprises can have a huge impact on a company's stock price. Several studies suggest that positive earnings surprises not only lead to an immediate hike in a stock's price, but also to a gradual increase over time. Hence, it's not surprising that some companies are known for routinely beating earning projections. A negative earnings surprise will usually result in a decline in share price.

Next Day Price Change (%)

Next Regular trading session Closing price following Earnings result.

For After Market Close Earnings, It is a next trading day closing price. For Before Market Open Earnings, It is the same trading day closing price.

Why is it Important?

Next Day price change is a reaction of Earnings result.

Domino’s Pizza Beat Q3 Estimates, but the Sales Engine Is Losing Steam

Posted on Oct 15, 2026 by Grayson Cavern

Domino’s Pizza Beat Q3 Estimates, but the Sales Engine Is Losing Steam

Domino’s Pizza (NASDAQ: DPZ) has a problem that a quarterly earnings beat cannot fix on its own. The company generated $1.19 billion in revenue and $4.60 in diluted EPS for the third quarter, topping Wall Street’s estimates on both lines. Yet U.S. same-store sales barely grew, international comps slowed, and management pulled back its full-year sales expectations. Meanwhile, DPZ has slid from roughly $370 in August to below $300.

The stock is now caught between a business that can still manufacture earnings growth and a sales trend that is losing momentum. The distinction runs through the entire report: Domino’s is squeezing more out of its operating model, but the underlying demand picture is getting harder to defend.

The Beat Came From More Than Customer Demand


Revenue rose 3.4% year over year to $1.19 billion, ahead of the $1.18 billion analyst consensus. EPS climbed 12.7% to $4.60, beating expectations of $4.37, while operating income increased 8.3% to $241.8 million. On the surface, those are respectable results. The comparable-store figures tell a less comfortable story.

U.S. same-store sales grew just 0.3%, down from 5.2% a year earlier. International comps increased 0.2%, compared with 1.7% last year. Global retail sales growth, excluding foreign currency effects, slowed to 3.2% from 6.3%. U.S. retail sales grew 2.1%, while international retail sales increased 4.3%.
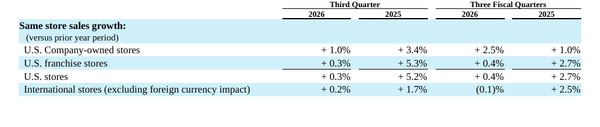
Source: Domino’s Pizza

Domino’s is still selling more across its system, but the pace has cooled sharply. Comparable-store sales strip away much of the benefit from opening new locations, giving investors a cleaner read on how existing restaurants are performing. When that measure nearly stalls in both the U.S. and international markets, a headline earnings beat deserves a closer look.

Part of the answer sits in the supply chain. Revenue benefited from higher order volumes and a 2.2% increase in food-basket pricing, while supply-chain gross margin expanded to 12.2% from 11.3%, helped by procurement productivity. Share repurchases also supported EPS growth.

Those levers are doing their job. Better purchasing economics can protect margins, and repurchases allow earnings to be spread across fewer shares. But neither can substitute indefinitely for stronger customer demand. If established stores keep struggling to grow sales, Domino’s will have less room to lean on operational efficiencies to keep the earnings line moving higher.

Management Has Cut Its Sales Expectations

The revised outlook is the part I would keep in focus. Domino’s now expects U.S. same-store sales growth toward the low end of its low-single-digit range, while international comparable sales are expected to be approximately flat. The company also reduced its 2026 U.S. net store growth target to 125–150 locations, citing macroeconomic pressure on development and franchisee profitability.

That is a meaningful change in tone after a quarter that beat estimates. The reported numbers describe the business over the last three months; guidance tells investors what management believes it can deliver next. Lower expectations for comps and store openings make the forward growth profile less compelling, even with earnings holding up.

New CEO Joe Jordan has emphasized customer engagement and franchisee profitability. Both priorities land directly on the problem in these results. Domino’s needs to give customers a reason to order more frequently while keeping the economics attractive for the franchisees operating its stores.

Promotions can bring customers through the door, especially when budgets are tight. The trade-off is that discounting can pressure ticket size and store-level profitability if incremental orders fail to compensate for lower prices. The company needs traffic that sticks, not a short-lived sales bump purchased with margin.

Slower store development adds another complication. Domino’s relies on its franchise network to extend its reach without carrying the full cost of every new restaurant. When franchisees face weaker economics, expansion becomes harder to justify, and that removes one of the growth levers that can offset sluggish sales at existing locations.

DPZ Is Fighting to Hold the High-$280s

The chart has been pricing in this loss of momentum for months. DPZ closed October 14 at $295.89, below its 20-day simple moving average at $298.85, its 50-day at $323.16 and its 200-day at $348.71. The retreat from the August high near $370 has left the stock in a sustained downtrend, with each moving average sitting overhead as potential resistance.

The first level to reclaim is $299–$300. Getting back above the 20-day average would offer an early sign that buyers are willing to defend the recent bounce. Beyond that, $315–$323 is the more demanding test, with the 50-day average near $323. A move through that zone would improve the technical picture; until then, rallies remain vulnerable to sellers stepping back in.

Support sits around $285–$290, near the rising trendline on the chart. DPZ has recently bounced from this area, making it the line bulls need to defend. A decisive break would undermine the attempt to establish a floor and raise the risk of another leg down.
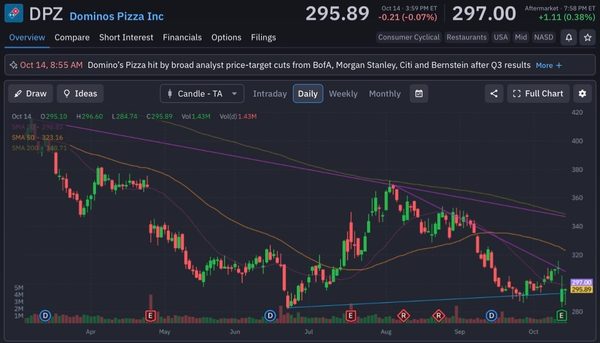
domino's - StockEarnings

The Stock Needs a Better Sales Story

Domino’s still has real advantages: franchise scale, supply-chain leverage and a business model capable of producing earnings growth in a difficult consumer environment. Q3 showed those strengths in action. It also showed how much work remains on comparable sales, and management’s lower outlook makes it difficult to dismiss that weakness as a temporary quarterly wobble.

My bias remains cautious until the sales trend improves. This means I would treat DPZ’s bounce as an attempt to find a bottom, not proof that one is in. The next leg of the bullish thesis needs healthier demand at existing stores. Without it, operational efficiency can keep earnings respectable while the stock continues to struggle for a higher multiple.


Join over 1.2M+ investors/traders who receive daily and weekly notable earnings alerts with predicted move