ajax loader

Loading...


Ride-the-Wave Strategy – Best for Stock Traders

Ride-the-Wave targets multi-day price momentum following a company’s earnings announcement (EA). With this strategy:

  1. Buy a stock one day post-EA if a stock reacts positively post-earnings:
    1. Near the close of trading the EA-day for a pre-market-EA
    2. Near the close of the following day for a post-market-EA
  2. Sell-to-close after 7-10 days, or possibly earlier if a desired price target is reached

Similarly,

  1. short a stock one day post-EA if a stock reacts negatively post-earnings:
    1. near the close of trading the EA-day for a premarket-EA
    2. near the close of the following day for a post-market-EA
  2. then buy-to-close after 7-10 days, or possibly earlier if a desired price target is reached

Important: Ride-the-Wave is predicated on significant price momentum triggered by an EA. The 7-10 day scenario is the maximum trade hold-time. If you see post EA-momentum is halted or reversed by a significant opposite move, re-evaluate your presence in the trade.

This popular StockEarnings screen below will give you a list of stocks that historically exhibit significant price momentum following an EA for the next seven days:

  1. Stocks exhibiting positive post-EA price moves are buy-candidates
  2. Stocks exhibiting negative post-EA price moves are sell/short-candidates

The screen includes those stocks whose Earnings just came out in last two days.

Screen criteria:

  1. Earnings Date Start Date : Current Date + -1 Day
  2. Earnings Date End Date : Current Date + -2 Days
  3. Predicted Move (Next Day) Max : 7%
  4. Predicted Move (On 7th Day) Min : 7%

Strategy Guideline:

  1. Buy the stock if stock has reacted positively. Short the stock if stock has reacted negatively (see above).
  2. Close the position in 7-10 days, or possibly earlier based on price move.

Volatility Crush Strategy - Best for Options Traders

The Volatility Crush strategy is used with stocks that typically experience relatively low-to-moderate price moves (≤4%) following their Earnings Announcements (EA). The basic trade idea is to sell put or call options right before the EA, collecting a credit when options premium is very high due to elevated implied volatility (IV). You then close the position right after the EA by buying the option back much cheaper due to the significant drop in IV that occurs after the mystery of the EA disappears. In assessing this trade, you need to do your homework to ensure you collect sufficient premium to make the trade worthwhile.

This trade is practical due to the low-to-moderate price-move after the EA, which generally won’t significantly affect the options price, unlike an “action” stock, which experience great price moves post-EA. With these symbols, if you’re on the right side of the price move, that’s a great thing. But if you’re on the wrong side of the move, not so great. Consequently, by minimizing the effect of the post-EA price move, you have a much better chance to profit from the reduction in IV without it being ruined by a violent price move.

For this trade, open the position either (1) the night before the EA when the company announces earnings or (2) during the EA day when it announces post-market, generally capturing IV at or close to its peak.

For this trade, open the position either (1) the night before the EA when the company announces earnings or (2) during the EA day when it announces post-market, generally capturing IV at or close to its peak.

This popular stockearnings screen will give you a list of stocks which do not react more than 4% fpost-EA. It includes only those stocks whose earnings are releasing next day.

Screen criteria:

  1. Earnings Date Start Date : Current Date + 1
  2. Earnings Date End Date : Current Date + 1
  3. Predicted Move (Next Day) Max : 4%
  4. Options Type: Weekly

Strategy Guideline:

  1. Options Strategy: Sell Call and Put
  2. Options Strike Price: Current Stock Price – (% Predicated Move x 2)
  3. Expiration Date: It should generally be the closest expiry immediately after the EA.
  4. Buy Insurance: Buying back Call and Put at Strike price which 10% lower than Sell Strike Price is optional but recommended.

Watch Video for More Detail

Volatility Rush Strategy - Best for Options Traders

The Volatility Rush takes advantage of increasing options premiums into earnings announcements (EA) caused by an anticipated rise in Implied Volatility (IV). With this strategy, Buy a Call and Put at-the-money (a long straddle) 2-3 weeks before the EA when IV is lower. Sell the position either (1) the night before the EA when the company announces earnings pre-market, or (2) during the EA day when it announces post-market, generally capturing IV at or close to its peak.

This popular screen will give you a list of stocks whose Options premiums tend to rise into Earnings. It includes only those stocks whose Earnings are at least two weeks away from today.

Screen criteria:

  1. Earnings Date Start Date : Current Date + 15 Days
  2. Earnings Date End Date : Current Date + 30 Days
  3. Predicted Move (Next Day) Min : 5%
  4. Options Type: Weekly or Monthly if that lines up with the two to three-week lead-time for entering the trade

Strategy Guideline:

  1. Buy a Straddle at or close to the money two to three weeks pre-EA.
  2. Sell the position either the night before the EA when the company announces earnings pre-market, or during the EA day when it announces post-market.
  3. Expiration date should generally be the closest expiry immediately after the EA.
  4. Straddle price should not be more 60% of predicted move.

Predicted Move (Volatility)

Similar to Implied Volatility in Options. Expected volatility % based on our Proprietary Volatility Predication Model. We are expecting that stock price will likely to reach % in either direction by the end of next trading session after Earnings are released and not necessarily the closing volatility %.

Why is it important?

    This indicator helps

  1. Knowing expected volatility in stocks after Earnings helps to decide trading stocks before Earnings Announcement.
  2. Taking Advantage of volatility collapse following Earnings Results by using Advance Options strategies such as Spread and Straddles.

Since Last Earnings

Change in share price since last Earnings release.

Why is it Important?

When share has gained more than 10% since it's last Earning release, it tends to over react to minor bad news and give up some gains if not all. So, it contains more downside volatility than upside When share has dropped more than 10% since it's last Earning release, it tends to over react to minor good news and recover some drops if not all. So, it contains more upside volatility than downside.

EPS Surprise (%)

Occurs when a company's reported quarterly or annual profits are above or below analysts' expectations. Here is the formula to derive % EPS Surprice:

Actual EPS - Estimated EPS
------------------------------------- x 100
Estimated EPS

Why is it Important?

Earnings surprises can have a huge impact on a company's stock price. Several studies suggest that positive earnings surprises not only lead to an immediate hike in a stock's price, but also to a gradual increase over time. Hence, it's not surprising that some companies are known for routinely beating earning projections. A negative earnings surprise will usually result in a decline in share price.

Next Day Price Change (%)

Next Regular trading session Closing price following Earnings result.

For After Market Close Earnings, It is a next trading day closing price. For Before Market Open Earnings, It is the same trading day closing price.

Why is it Important?

Next Day price change is a reaction of Earnings result.

Morgan Stanley’s Powerful $105 Billion Franchise Has One Big Weakness

Posted on Oct 15, 2026 by Grayson Cavern

Morgan Stanley’s Powerful $105 Billion Franchise Has One Big Weakness

Morgan Stanley (NYSE: MS) is generating billions in profits, pulling in new client assets and producing a 22.6% return on tangible common equity. Yet the stock closed October 14 at $181.51, down sharply from its summer peak near $230. The third-quarter report gives investors a reason to stay interested in the franchise, but the numbers also expose a split between its strongest businesses and the parts losing momentum.

Revenue climbed 12% year over year to $20.34 billion, while diluted EPS rose from $2.80 to $3.03.  The bigger story sits inside those results: Wealth Management is expanding its recurring-fee base, while Institutional Securities is riding a powerful equities business. Investment Management, meanwhile, is dragging. That uneven performance helps explain why a strong earnings report has yet to turn the stock around.

Equities Are Carrying the Institutional Business


Institutional Securities generated $10.03 billion in third-quarter revenue, up from $8.52 billion a year earlier. Equities supplied most of the lift, with revenue surging 41% to $5.80 billion on stronger client engagement across regions, particularly Asia. Investment banking revenue increased 2% to $2.16 billion, helped by higher advisory revenue from completed M&A activity in the Americas. 

The weak spot was fixed income. Revenue declined 7% to $2.01 billion, reflecting lower performance in credit, securitized products, and commodities. Equity underwriting also fell from $652 million to $525 million as lower IPO and block activity outweighed higher follow-on offerings. 

That mix makes the headline growth less straightforward than it first appears. Morgan Stanley has a powerful equities franchise, but a 41% jump in trading revenue can be difficult to repeat if client activity cools. Investment banking is improving, yet its growth remains modest beside equities. The next leg of institutional earnings growth needs broader participation across the segment.

Wealth Management Is Building a Larger Earnings Engine

Wealth Management delivered record revenue of $9.07 billion, up 10% year over year, and record pretax income of $2.8 billion, producing a 30.4% pretax margin. The business attracted $232.4 billion in net new assets and $80.5 billion in fee-based flows during the quarter. Fee-based client assets reached $3.16 trillion, up from $2.65 trillion a year earlier. 

Those figures offer the strongest support for the long-term thesis. A growing pool of fee-generating assets can produce recurring revenue across market cycles, while the advisor-led channel keeps bringing new money onto the platform. Morgan Stanley also reported $201.1 billion in loans, compared with $173.9 billion a year earlier, as lending growth and higher average sweep deposits helped lift net interest income to $2.23 billion from $1.99 billion. 

Keep in mind, just over half of the quarter’s net new assets were associated with IPO-related flows.  That makes the record inflow figure less useful as a standalone measure of recurring momentum. Still, the combination of larger fee-based assets, stronger net interest income and a 30.4% pretax margin gives Wealth Management real weight in the earnings mix.

Investment Management generated $1.46 billion in revenue, down 12% from $1.65 billion a year earlier. Pretax income fell to $259 million from $364 million. Asset management and related fees increased to $1.57 billion, but performance-based income and other revenue swung to a $106 million loss from $117 million in positive revenue a year earlier. The company attributed the decline primarily to a reversal of accrued carried interest tied to certain private-fund investments. 

That reversal helps explain why the segment’s results weakened even as assets under management rose to $2.05 trillion from $1.81 trillion. Long-term net flows were $15.8 billion, below the $17.9 billion recorded a year earlier. 

The broader business is growing, but that growth is not reaching every earnings line evenly. Morgan Stanley’s consolidated revenue fell from $21.35 billion in Q2 to $20.34 billion in Q3, while EPS declined from $3.46 to $3.03. ROTCE also eased from 26.6% to 22.6%.  The year-over-year trend remains positive, but the sequential pullback shows the firm has stepped down from a stronger quarter.

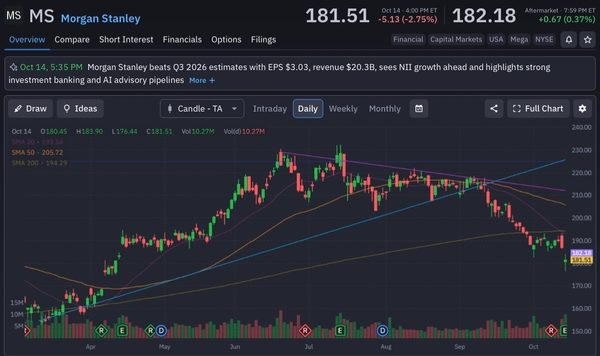
MS Needs to Reclaim $194

The stock is still under pressure. MS closed at $181.51, below its 20-day moving average at $193.14, its 50-day at $205.72, and its 200-day at $194.29. The rising trendline from the spring has broken, and the stock has retreated from its summer high near $230. 

The first challenge is $190–$194, where the 200-day average sits near recent price action. A reclaim would be an initial sign that buyers are returning. Above that, $205–$212 is a tougher resistance zone. On the downside, the recent low around $176 is the level to watch; a break could expose the stock to another leg lower.

Morgan Stanley repurchased $1.54 billion in shares during the quarter and declared a $1.15 quarterly dividend. Its standardized Common Equity Tier 1 capital ratio stood at 14.9%.  The franchise has scale, capital, and a growing wealth business. I’m sold on those fundamentals, but I would want to see MS reclaim $194 before treating the selloff as exhausted. The next bullish leg needs the chart to catch up with the business.
morgan stanley - StockEarnings

Join over 1.2M+ investors/traders who receive daily and weekly notable earnings alerts with predicted move
