ajax loader

Loading...


Ride-the-Wave Strategy – Best for Stock Traders

Ride-the-Wave targets multi-day price momentum following a company’s earnings announcement (EA). With this strategy:

  1. Buy a stock one day post-EA if a stock reacts positively post-earnings:
    1. Near the close of trading the EA-day for a pre-market-EA
    2. Near the close of the following day for a post-market-EA
  2. Sell-to-close after 7-10 days, or possibly earlier if a desired price target is reached

Similarly,

  1. short a stock one day post-EA if a stock reacts negatively post-earnings:
    1. near the close of trading the EA-day for a premarket-EA
    2. near the close of the following day for a post-market-EA
  2. then buy-to-close after 7-10 days, or possibly earlier if a desired price target is reached

Important: Ride-the-Wave is predicated on significant price momentum triggered by an EA. The 7-10 day scenario is the maximum trade hold-time. If you see post EA-momentum is halted or reversed by a significant opposite move, re-evaluate your presence in the trade.

This popular StockEarnings screen below will give you a list of stocks that historically exhibit significant price momentum following an EA for the next seven days:

  1. Stocks exhibiting positive post-EA price moves are buy-candidates
  2. Stocks exhibiting negative post-EA price moves are sell/short-candidates

The screen includes those stocks whose Earnings just came out in last two days.

Screen criteria:

  1. Earnings Date Start Date : Current Date + -1 Day
  2. Earnings Date End Date : Current Date + -2 Days
  3. Predicted Move (Next Day) Max : 7%
  4. Predicted Move (On 7th Day) Min : 7%

Strategy Guideline:

  1. Buy the stock if stock has reacted positively. Short the stock if stock has reacted negatively (see above).
  2. Close the position in 7-10 days, or possibly earlier based on price move.

Volatility Crush Strategy - Best for Options Traders

The Volatility Crush strategy is used with stocks that typically experience relatively low-to-moderate price moves (≤4%) following their Earnings Announcements (EA). The basic trade idea is to sell put or call options right before the EA, collecting a credit when options premium is very high due to elevated implied volatility (IV). You then close the position right after the EA by buying the option back much cheaper due to the significant drop in IV that occurs after the mystery of the EA disappears. In assessing this trade, you need to do your homework to ensure you collect sufficient premium to make the trade worthwhile.

This trade is practical due to the low-to-moderate price-move after the EA, which generally won’t significantly affect the options price, unlike an “action” stock, which experience great price moves post-EA. With these symbols, if you’re on the right side of the price move, that’s a great thing. But if you’re on the wrong side of the move, not so great. Consequently, by minimizing the effect of the post-EA price move, you have a much better chance to profit from the reduction in IV without it being ruined by a violent price move.

For this trade, open the position either (1) the night before the EA when the company announces earnings or (2) during the EA day when it announces post-market, generally capturing IV at or close to its peak.

For this trade, open the position either (1) the night before the EA when the company announces earnings or (2) during the EA day when it announces post-market, generally capturing IV at or close to its peak.

This popular stockearnings screen will give you a list of stocks which do not react more than 4% fpost-EA. It includes only those stocks whose earnings are releasing next day.

Screen criteria:

  1. Earnings Date Start Date : Current Date + 1
  2. Earnings Date End Date : Current Date + 1
  3. Predicted Move (Next Day) Max : 4%
  4. Options Type: Weekly

Strategy Guideline:

  1. Options Strategy: Sell Call and Put
  2. Options Strike Price: Current Stock Price – (% Predicated Move x 2)
  3. Expiration Date: It should generally be the closest expiry immediately after the EA.
  4. Buy Insurance: Buying back Call and Put at Strike price which 10% lower than Sell Strike Price is optional but recommended.

Watch Video for More Detail

Volatility Rush Strategy - Best for Options Traders

The Volatility Rush takes advantage of increasing options premiums into earnings announcements (EA) caused by an anticipated rise in Implied Volatility (IV). With this strategy, Buy a Call and Put at-the-money (a long straddle) 2-3 weeks before the EA when IV is lower. Sell the position either (1) the night before the EA when the company announces earnings pre-market, or (2) during the EA day when it announces post-market, generally capturing IV at or close to its peak.

This popular screen will give you a list of stocks whose Options premiums tend to rise into Earnings. It includes only those stocks whose Earnings are at least two weeks away from today.

Screen criteria:

  1. Earnings Date Start Date : Current Date + 15 Days
  2. Earnings Date End Date : Current Date + 30 Days
  3. Predicted Move (Next Day) Min : 5%
  4. Options Type: Weekly or Monthly if that lines up with the two to three-week lead-time for entering the trade

Strategy Guideline:

  1. Buy a Straddle at or close to the money two to three weeks pre-EA.
  2. Sell the position either the night before the EA when the company announces earnings pre-market, or during the EA day when it announces post-market.
  3. Expiration date should generally be the closest expiry immediately after the EA.
  4. Straddle price should not be more 60% of predicted move.

Predicted Move (Volatility)

Similar to Implied Volatility in Options. Expected volatility % based on our Proprietary Volatility Predication Model. We are expecting that stock price will likely to reach % in either direction by the end of next trading session after Earnings are released and not necessarily the closing volatility %.

Why is it important?

    This indicator helps

  1. Knowing expected volatility in stocks after Earnings helps to decide trading stocks before Earnings Announcement.
  2. Taking Advantage of volatility collapse following Earnings Results by using Advance Options strategies such as Spread and Straddles.

Since Last Earnings

Change in share price since last Earnings release.

Why is it Important?

When share has gained more than 10% since it's last Earning release, it tends to over react to minor bad news and give up some gains if not all. So, it contains more downside volatility than upside When share has dropped more than 10% since it's last Earning release, it tends to over react to minor good news and recover some drops if not all. So, it contains more upside volatility than downside.

EPS Surprise (%)

Occurs when a company's reported quarterly or annual profits are above or below analysts' expectations. Here is the formula to derive % EPS Surprice:

Actual EPS - Estimated EPS
------------------------------------- x 100
Estimated EPS

Why is it Important?

Earnings surprises can have a huge impact on a company's stock price. Several studies suggest that positive earnings surprises not only lead to an immediate hike in a stock's price, but also to a gradual increase over time. Hence, it's not surprising that some companies are known for routinely beating earning projections. A negative earnings surprise will usually result in a decline in share price.

Next Day Price Change (%)

Next Regular trading session Closing price following Earnings result.

For After Market Close Earnings, It is a next trading day closing price. For Before Market Open Earnings, It is the same trading day closing price.

Why is it Important?

Next Day price change is a reaction of Earnings result.

JNJ Stock Slides After Guidance Raise: Know What You Own, Buy the Dip

Posted on Oct 14, 2026 by Chris Markoch

JNJ Stock Slides After Guidance Raise: Know What You Own, Buy the Dip

Johnson & Johnson (NYSE: JNJ) raised its full-year guidance again in its third-quarter earnings report on October 13. Wall Street’s response was to sell the stock. JNJ stock fell 5.6% for the session, closing at $248.90.

The top line was strong. Revenue rose 5.9% to $25.4 billion, ahead of the roughly $25.3 billion analysts expected. Operational growth was 6%, and U.S. sales jumped 9.1%.

Management also raised its outlook again. The company now expects reported sales of $101.2 billion at the midpoint. It raised adjusted earnings per share (EPS) guidance by six cents to $11.10 per share.

So why the selling? Some of the numbers needed explaining. GAAP earnings fell to nine cents per share from $2.12 a year ago. That reflects a one-time charge for the proposed talc settlement and two strategic deals. Adjusted EPS of $2.59 also fell from last year because of those deals.

None of that changes the core business. It did give investors a reason to lock in gains after a strong 12 months.

This is a familiar pattern for JNJ. The stock often drifts lower after earnings, even good ones. Investors who react to the drop often miss the bigger story.

My view is simple: know what you own. Johnson & Johnson is a dividend king with a growing business and a growing payout. This pullback looks like a buying opportunity.

Why Johnson & Johnson Stock Fell After a Solid Quarter


The quarter was not perfect. The weakest spot was MedTech, where sales grew just 2.5%. That trailed the 7.9% operational growth in Innovative Medicine by a wide margin. Electrophysiology, Shockwave, and contact lenses drove gains, but not enough to impress.

jnj - StockEarnings

International sales were also soft, rising only 1.5%. Meanwhile, biosimilar competition for Stelara cut about 6.9 percentage points from Innovative Medicine growth.

Then there’s the talc litigation. In July, J&J proposed a $5.5 billion settlement covering about 76,000 ovarian cancer claims. The charge landed this quarter. The deal still needs at least 95% of claimants to participate, so it isn’t final.

Finally, the acquisition of Firefly Bio and a collaboration with Sail Biomedicines weighed on adjusted earnings. Adjusted EPS fell 7.5% year-over-year. Full-year adjusted EPS is now projected to grow just 2.9%.

Investors who skim headlines saw a 96% drop in net earnings. For many, that was enough to sell.

Know What You Own: A Dividend King Built for Long-Term Investors

Johnson & Johnson has raised its dividend for 64 consecutive years. The quarterly payout is $1.34, or $5.36 per share annually. That’s a yield of about 2.16% at recent prices.

Consider what that streak has survived. The talc lawsuits have been in the headlines for 15 years. The dividend kept rising anyway.

This is also a different company than it was a few years ago. J&J separated its consumer health business into Kenvue in 2023. What remains is a leaner, higher-margin company focused on pharmaceuticals and medical devices. A planned separation of the orthopaedics business should sharpen that focus further.

The pipeline gives investors reasons for patience. The FDA authorized the OTTAVA robotic surgical system this quarter. IMAAVY won approval for a rare autoimmune blood disorder. Five-year data showed CARVYKTI produced treatment-free remissions in half of patients in early-line multiple myeloma.

The cash engine is intact, too. Free cash flow is about $15.1 billion through three quarters.

Over the last five years, JNJ stock has gained roughly 55%. Add the dividend, and long-term owners have been well rewarded.

Reasonable Risks for Trading JNJ, But Not for Owning It

There are legitimate reasons to be cautious with JNJ in the short term. MedTech growth remains modest. Stelara erosion will keep weighing on reported growth. The talc settlement could still face hurdles if claimant participation falls short.

Earnings growth this year is also muted. Acquisition costs mean adjusted EPS is expected to rise less than 3% in 2026.

For traders, those are real issues. They can keep the stock range-bound for weeks or months.

For long-term owners, the picture is different. Revenue is growing about 7% this year. Management says it has a clearer line of sight to double-digit growth by the end of the decade. The dividend is well covered by free cash flow.

The risks here are about timing, not the thesis. That’s the difference between trading a stock and owning one.

JNJ Stock Technical Analysis: Testing Support After a Sharp Pullback

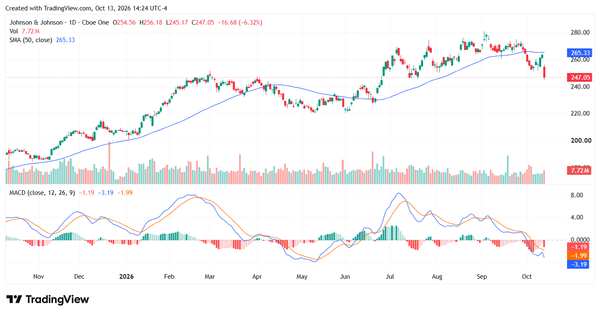
The chart shows a stock that ran from around $190 last October to a high near $280 in September. Some profit-taking was overdue.

Today’s drop came on above-average volume of 7.7 million shares. The stock is trading near $247, well below its 50-day moving average of $265.

There are warning signs. Shares had already slipped below the 50-day average in early October. A brief rebound toward that line failed before earnings. The MACD is below zero and below its signal line, which shows bearish momentum.

Support is the key level to watch. The $245 area held in July. Below that, the $240 zone from the spring is the next floor.

A hold above $240 would support the profit-taking case. Patient investors can scale into positions rather than buy all at once.
jnj - StockEarnings

Bottom Line: JNJ’s Dip Is a Chance to Buy Quality

Johnson & Johnson delivered higher sales and raised guidance again. The market focused on a weak MedTech quarter, talc charges, and deal-related earnings pressure.

Those are fair concerns for short-term traders. They don’t change what long-term investors own: a dividend king with 64 years of increases, a strong pipeline, and steady cash flow.

JNJ has a habit of drifting lower after earnings. For investors who know what they own, that habit has often created buying opportunities.

This looks like another one.

A former marketing copywriter turned freelance financial writer and market analyst. I have a passion for delivering insights to investors. I write regularly about stocks for StockEarnings and MarketBeat. Posts are not advice.

Join over 1.2M+ investors/traders who receive daily and weekly notable earnings alerts with predicted move
