ajax loader

Loading...


Ride-the-Wave Strategy – Best for Stock Traders

Ride-the-Wave targets multi-day price momentum following a company’s earnings announcement (EA). With this strategy:

  1. Buy a stock one day post-EA if a stock reacts positively post-earnings:
    1. Near the close of trading the EA-day for a pre-market-EA
    2. Near the close of the following day for a post-market-EA
  2. Sell-to-close after 7-10 days, or possibly earlier if a desired price target is reached

Similarly,

  1. short a stock one day post-EA if a stock reacts negatively post-earnings:
    1. near the close of trading the EA-day for a premarket-EA
    2. near the close of the following day for a post-market-EA
  2. then buy-to-close after 7-10 days, or possibly earlier if a desired price target is reached

Important: Ride-the-Wave is predicated on significant price momentum triggered by an EA. The 7-10 day scenario is the maximum trade hold-time. If you see post EA-momentum is halted or reversed by a significant opposite move, re-evaluate your presence in the trade.

This popular StockEarnings screen below will give you a list of stocks that historically exhibit significant price momentum following an EA for the next seven days:

  1. Stocks exhibiting positive post-EA price moves are buy-candidates
  2. Stocks exhibiting negative post-EA price moves are sell/short-candidates

The screen includes those stocks whose Earnings just came out in last two days.

Screen criteria:

  1. Earnings Date Start Date : Current Date + -1 Day
  2. Earnings Date End Date : Current Date + -2 Days
  3. Predicted Move (Next Day) Max : 7%
  4. Predicted Move (On 7th Day) Min : 7%

Strategy Guideline:

  1. Buy the stock if stock has reacted positively. Short the stock if stock has reacted negatively (see above).
  2. Close the position in 7-10 days, or possibly earlier based on price move.

Volatility Crush Strategy - Best for Options Traders

The Volatility Crush strategy is used with stocks that typically experience relatively low-to-moderate price moves (≤4%) following their Earnings Announcements (EA). The basic trade idea is to sell put or call options right before the EA, collecting a credit when options premium is very high due to elevated implied volatility (IV). You then close the position right after the EA by buying the option back much cheaper due to the significant drop in IV that occurs after the mystery of the EA disappears. In assessing this trade, you need to do your homework to ensure you collect sufficient premium to make the trade worthwhile.

This trade is practical due to the low-to-moderate price-move after the EA, which generally won’t significantly affect the options price, unlike an “action” stock, which experience great price moves post-EA. With these symbols, if you’re on the right side of the price move, that’s a great thing. But if you’re on the wrong side of the move, not so great. Consequently, by minimizing the effect of the post-EA price move, you have a much better chance to profit from the reduction in IV without it being ruined by a violent price move.

For this trade, open the position either (1) the night before the EA when the company announces earnings or (2) during the EA day when it announces post-market, generally capturing IV at or close to its peak.

For this trade, open the position either (1) the night before the EA when the company announces earnings or (2) during the EA day when it announces post-market, generally capturing IV at or close to its peak.

This popular stockearnings screen will give you a list of stocks which do not react more than 4% fpost-EA. It includes only those stocks whose earnings are releasing next day.

Screen criteria:

  1. Earnings Date Start Date : Current Date + 1
  2. Earnings Date End Date : Current Date + 1
  3. Predicted Move (Next Day) Max : 4%
  4. Options Type: Weekly

Strategy Guideline:

  1. Options Strategy: Sell Call and Put
  2. Options Strike Price: Current Stock Price – (% Predicated Move x 2)
  3. Expiration Date: It should generally be the closest expiry immediately after the EA.
  4. Buy Insurance: Buying back Call and Put at Strike price which 10% lower than Sell Strike Price is optional but recommended.

Watch Video for More Detail

Volatility Rush Strategy - Best for Options Traders

The Volatility Rush takes advantage of increasing options premiums into earnings announcements (EA) caused by an anticipated rise in Implied Volatility (IV). With this strategy, Buy a Call and Put at-the-money (a long straddle) 2-3 weeks before the EA when IV is lower. Sell the position either (1) the night before the EA when the company announces earnings pre-market, or (2) during the EA day when it announces post-market, generally capturing IV at or close to its peak.

This popular screen will give you a list of stocks whose Options premiums tend to rise into Earnings. It includes only those stocks whose Earnings are at least two weeks away from today.

Screen criteria:

  1. Earnings Date Start Date : Current Date + 15 Days
  2. Earnings Date End Date : Current Date + 30 Days
  3. Predicted Move (Next Day) Min : 5%
  4. Options Type: Weekly or Monthly if that lines up with the two to three-week lead-time for entering the trade

Strategy Guideline:

  1. Buy a Straddle at or close to the money two to three weeks pre-EA.
  2. Sell the position either the night before the EA when the company announces earnings pre-market, or during the EA day when it announces post-market.
  3. Expiration date should generally be the closest expiry immediately after the EA.
  4. Straddle price should not be more 60% of predicted move.

Predicted Move (Volatility)

Similar to Implied Volatility in Options. Expected volatility % based on our Proprietary Volatility Predication Model. We are expecting that stock price will likely to reach % in either direction by the end of next trading session after Earnings are released and not necessarily the closing volatility %.

Why is it important?

    This indicator helps

  1. Knowing expected volatility in stocks after Earnings helps to decide trading stocks before Earnings Announcement.
  2. Taking Advantage of volatility collapse following Earnings Results by using Advance Options strategies such as Spread and Straddles.

Since Last Earnings

Change in share price since last Earnings release.

Why is it Important?

When share has gained more than 10% since it's last Earning release, it tends to over react to minor bad news and give up some gains if not all. So, it contains more downside volatility than upside When share has dropped more than 10% since it's last Earning release, it tends to over react to minor good news and recover some drops if not all. So, it contains more upside volatility than downside.

EPS Surprise (%)

Occurs when a company's reported quarterly or annual profits are above or below analysts' expectations. Here is the formula to derive % EPS Surprice:

Actual EPS - Estimated EPS
------------------------------------- x 100
Estimated EPS

Why is it Important?

Earnings surprises can have a huge impact on a company's stock price. Several studies suggest that positive earnings surprises not only lead to an immediate hike in a stock's price, but also to a gradual increase over time. Hence, it's not surprising that some companies are known for routinely beating earning projections. A negative earnings surprise will usually result in a decline in share price.

Next Day Price Change (%)

Next Regular trading session Closing price following Earnings result.

For After Market Close Earnings, It is a next trading day closing price. For Before Market Open Earnings, It is the same trading day closing price.

Why is it Important?

Next Day price change is a reaction of Earnings result.

Inflation Climbs to 3.7%: What It Means for Your Wallets and Investments

Posted on Oct 14, 2026 by Ian Cooper

Inflation Climbs to 3.7%: What It Means for Your Wallets and Investments

Inflation picked up again in September, giving Americans another reason to watch their budgets and giving the Federal Reserve less room to offer relief on interest rates.

The Consumer Price Index, or CPI, showed that consumer prices rose 3.7% over the past year, up from 3.4% in August. Prices increased 0.6% during September alone, compared with a 0.4% increase the previous month. Gasoline accounted for more than half of that monthly jump.

For consumers, everyday expenses are taking another bite out of their paychecks. For investors, the question is whether stubborn inflation will push interest rates higher and make it harder for companies to grow their profits.

What Is Driving Prices Higher?


Gasoline was the biggest problem in September, rising 9.1% on a seasonally adjusted basis. Shelter costs also increased 0.4%. However, that has been good news for investors who jumped into oil stocks, like Exxon Mobil (NYSE: XOM) and Chevron (NYSE: CVX).

There was some relief at the grocery store. Food prices overall were unchanged, while grocery prices slipped 0.1%. That helps, although a small monthly decline hardly erases the increases households have absorbed over time.

Economists also watch “core” inflation, which excludes food and energy because those prices can swing sharply. Think of it as a way to see whether inflation is spreading beyond volatile categories. Core prices rose 0.3% in September and 2.6% over the past year, compared with an annual increase of 2.4% in August. That suggests the inflation challenge extends beyond filling up the gas tank.

Could Interest Rates Go Higher?

Today’s report strengthens the argument for keeping interest rates elevated. It could also support another increase if upcoming data show that price pressures are becoming more persistent. The CME FedWatch Tool puts odds of a 25 basis-point (0.25%) interest rate hike in December at 58%.
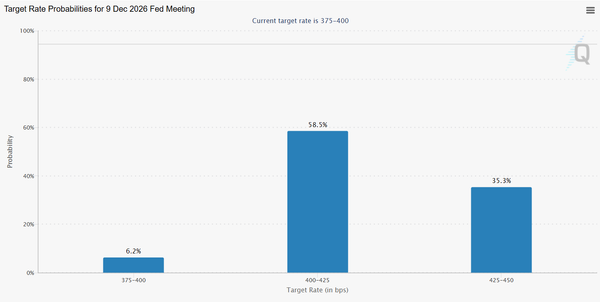
inflation - StockEarnings
Source: CMEGroup

The Fed already raised its benchmark interest-rate range by a quarter percentage point in September, bringing it to 3.75% to 4%. In its announcement, officials said inflation remained elevated and described the increase as a step toward restoring price stability.

The idea behind higher rates is simple. When borrowing becomes more expensive, households and businesses tend to spend more cautiously. That can cool demand and reduce the pressure on prices. But the effects take time.

There is also a limit to what interest rates can accomplish. Higher borrowing costs cannot immediately produce more gasoline or fix a supply disruption. Officials have to judge whether an energy price jump will fade or lead to broader, lasting increases.

One important distinction: the Fed’s 2% inflation target applies to the Personal Consumption Expenditures price index, or PCE. Today’s CPI report is influential, but it is not the exact measure the Fed targets.

Another rate increase is therefore a possibility, not a certainty. Employment, spending, and future inflation reports will all matter.

Consumers Could Feel Pressure From Both Directions

For households, the difficult combination is higher prices alongside expensive borrowing.

When essentials cost more, there is less money available for restaurant meals, vacations, home improvements, or savings. Families can postpone some purchases, but commuting to work and keeping a roof overhead are harder to avoid. 

Borrowing can add another layer of pressure. If interest rates remain elevated, financing a car or carrying a credit-card balance can remain costly. Higher rates influence household spending through the price and availability of credit.

Why Wall Street Will Be Watching Closely

For stocks, persistent inflation creates two potential problems: pressure on profits and pressure on the prices investors are willing to pay for those profits.

A company facing higher expenses has a choice. It can raise prices and risk losing customers, or absorb those costs and accept lower margins. Businesses with loyal customers and strong finances may handle that trade-off better than competitors.

Interest rates matter, too. Higher bond yields can make stocks less attractive by giving investors another place to earn income. Higher financing costs can also discourage business expansion.

That does not mean one inflation report guarantees a market selloff. Earnings, expectations, and what investors already anticipated also shape the reaction.

The next test is whether companies can keep growing while consumers face tighter budgets. Watch borrowing costs, spending trends, and management commentary. If inflation cools, that pressure could ease. If it persists, both households and Wall Street may have to wait longer for meaningful relief.


Over the last 26 years, he’s taught thousands of investors how to trade news flow and herd mentality using a unique blend of technical and fundamental analysis. Cooper was among the few analysts to spot the financial crisis of 2008, the top of subprime and Alt-A, the death of Lehman Brothers, Bear Stearns, and New Century Financial, and even the Dow’s collapse to 6,500, as well as its recovery. He even called for gold to rally well above $1.500 when it traded under $600. At the moment, Cooper makes use of technical, fundamental and news analysis, to help individual investors grow their wealth. He’s a firm believer that hard work and thorough research will lead to investment success.

Join over 1.2M+ investors/traders who receive daily and weekly notable earnings alerts with predicted move