ajax loader

Loading...


Ride-the-Wave Strategy – Best for Stock Traders

Ride-the-Wave targets multi-day price momentum following a company’s earnings announcement (EA). With this strategy:

  1. Buy a stock one day post-EA if a stock reacts positively post-earnings:
    1. Near the close of trading the EA-day for a pre-market-EA
    2. Near the close of the following day for a post-market-EA
  2. Sell-to-close after 7-10 days, or possibly earlier if a desired price target is reached

Similarly,

  1. short a stock one day post-EA if a stock reacts negatively post-earnings:
    1. near the close of trading the EA-day for a premarket-EA
    2. near the close of the following day for a post-market-EA
  2. then buy-to-close after 7-10 days, or possibly earlier if a desired price target is reached

Important: Ride-the-Wave is predicated on significant price momentum triggered by an EA. The 7-10 day scenario is the maximum trade hold-time. If you see post EA-momentum is halted or reversed by a significant opposite move, re-evaluate your presence in the trade.

This popular StockEarnings screen below will give you a list of stocks that historically exhibit significant price momentum following an EA for the next seven days:

  1. Stocks exhibiting positive post-EA price moves are buy-candidates
  2. Stocks exhibiting negative post-EA price moves are sell/short-candidates

The screen includes those stocks whose Earnings just came out in last two days.

Screen criteria:

  1. Earnings Date Start Date : Current Date + -1 Day
  2. Earnings Date End Date : Current Date + -2 Days
  3. Predicted Move (Next Day) Max : 7%
  4. Predicted Move (On 7th Day) Min : 7%

Strategy Guideline:

  1. Buy the stock if stock has reacted positively. Short the stock if stock has reacted negatively (see above).
  2. Close the position in 7-10 days, or possibly earlier based on price move.

Volatility Crush Strategy - Best for Options Traders

The Volatility Crush strategy is used with stocks that typically experience relatively low-to-moderate price moves (≤4%) following their Earnings Announcements (EA). The basic trade idea is to sell put or call options right before the EA, collecting a credit when options premium is very high due to elevated implied volatility (IV). You then close the position right after the EA by buying the option back much cheaper due to the significant drop in IV that occurs after the mystery of the EA disappears. In assessing this trade, you need to do your homework to ensure you collect sufficient premium to make the trade worthwhile.

This trade is practical due to the low-to-moderate price-move after the EA, which generally won’t significantly affect the options price, unlike an “action” stock, which experience great price moves post-EA. With these symbols, if you’re on the right side of the price move, that’s a great thing. But if you’re on the wrong side of the move, not so great. Consequently, by minimizing the effect of the post-EA price move, you have a much better chance to profit from the reduction in IV without it being ruined by a violent price move.

For this trade, open the position either (1) the night before the EA when the company announces earnings or (2) during the EA day when it announces post-market, generally capturing IV at or close to its peak.

For this trade, open the position either (1) the night before the EA when the company announces earnings or (2) during the EA day when it announces post-market, generally capturing IV at or close to its peak.

This popular stockearnings screen will give you a list of stocks which do not react more than 4% fpost-EA. It includes only those stocks whose earnings are releasing next day.

Screen criteria:

  1. Earnings Date Start Date : Current Date + 1
  2. Earnings Date End Date : Current Date + 1
  3. Predicted Move (Next Day) Max : 4%
  4. Options Type: Weekly

Strategy Guideline:

  1. Options Strategy: Sell Call and Put
  2. Options Strike Price: Current Stock Price – (% Predicated Move x 2)
  3. Expiration Date: It should generally be the closest expiry immediately after the EA.
  4. Buy Insurance: Buying back Call and Put at Strike price which 10% lower than Sell Strike Price is optional but recommended.

Watch Video for More Detail

Volatility Rush Strategy - Best for Options Traders

The Volatility Rush takes advantage of increasing options premiums into earnings announcements (EA) caused by an anticipated rise in Implied Volatility (IV). With this strategy, Buy a Call and Put at-the-money (a long straddle) 2-3 weeks before the EA when IV is lower. Sell the position either (1) the night before the EA when the company announces earnings pre-market, or (2) during the EA day when it announces post-market, generally capturing IV at or close to its peak.

This popular screen will give you a list of stocks whose Options premiums tend to rise into Earnings. It includes only those stocks whose Earnings are at least two weeks away from today.

Screen criteria:

  1. Earnings Date Start Date : Current Date + 15 Days
  2. Earnings Date End Date : Current Date + 30 Days
  3. Predicted Move (Next Day) Min : 5%
  4. Options Type: Weekly or Monthly if that lines up with the two to three-week lead-time for entering the trade

Strategy Guideline:

  1. Buy a Straddle at or close to the money two to three weeks pre-EA.
  2. Sell the position either the night before the EA when the company announces earnings pre-market, or during the EA day when it announces post-market.
  3. Expiration date should generally be the closest expiry immediately after the EA.
  4. Straddle price should not be more 60% of predicted move.

Predicted Move (Volatility)

Similar to Implied Volatility in Options. Expected volatility % based on our Proprietary Volatility Predication Model. We are expecting that stock price will likely to reach % in either direction by the end of next trading session after Earnings are released and not necessarily the closing volatility %.

Why is it important?

    This indicator helps

  1. Knowing expected volatility in stocks after Earnings helps to decide trading stocks before Earnings Announcement.
  2. Taking Advantage of volatility collapse following Earnings Results by using Advance Options strategies such as Spread and Straddles.

Since Last Earnings

Change in share price since last Earnings release.

Why is it Important?

When share has gained more than 10% since it's last Earning release, it tends to over react to minor bad news and give up some gains if not all. So, it contains more downside volatility than upside When share has dropped more than 10% since it's last Earning release, it tends to over react to minor good news and recover some drops if not all. So, it contains more upside volatility than downside.

EPS Surprise (%)

Occurs when a company's reported quarterly or annual profits are above or below analysts' expectations. Here is the formula to derive % EPS Surprice:

Actual EPS - Estimated EPS
------------------------------------- x 100
Estimated EPS

Why is it Important?

Earnings surprises can have a huge impact on a company's stock price. Several studies suggest that positive earnings surprises not only lead to an immediate hike in a stock's price, but also to a gradual increase over time. Hence, it's not surprising that some companies are known for routinely beating earning projections. A negative earnings surprise will usually result in a decline in share price.

Next Day Price Change (%)

Next Regular trading session Closing price following Earnings result.

For After Market Close Earnings, It is a next trading day closing price. For Before Market Open Earnings, It is the same trading day closing price.

Why is it Important?

Next Day price change is a reaction of Earnings result.

CoreWeave’s 300,000 Expiring GPUs Could Unlock $10 Billion in Revenue

Posted on Nov 11, 2026 by Grayson Cavern

CoreWeave’s 300,000 Expiring GPUs Could Unlock $10 Billion in Revenue

CoreWeave (NASDAQ: CRWV) is adding billions of dollars in quarterly sales. Yet, the cost of building and financing the infrastructure behind that growth is still swallowing a large share of the economics. The company’s third-quarter 2026 report put that tension in sharp relief.

Revenue reached $3.661 billion, up 168% year over year, while diluted loss per share widened to $1.27 from $0.22 a year earlier. Investors also got a glimpse of a different phase of the business, one that could let CoreWeave earn another round of revenue from GPUs it has already deployed and financed.

A Bigger Cloud Is Producing Better Operating Leverage


CoreWeave’s revenue has climbed from $1.365 billion in Q3 2025 to $3.661 billion in Q3 2026, with the latest quarter adding more than $1 billion sequentially. That growth is backed by a $132.5 billion revenue backlog, up 138% from a year ago, with more than half attached to contracts where customer delivery is expected to begin by year-end. 

The improvement is reaching the operating line as well, with GAAP operating income rising to $207 million from $52 million a year earlier and adjusted operating income climbing to $379 million from $217 million. Adjusted operating margin advanced from 1% in Q1 to 5% in Q2 and 10% in Q3, while adjusted EBITDA reached $2.256 billion at a 62% margin. 

Pricing has helped push those margins higher, with management reporting increases of approximately 25% across SKUs in July and another 10% later in the quarter, followed by further increases in Q4. Short-term contracts can now command more than $40 million per megawatt annually, while new four- and five-year contracts are moving toward $20 million to $25 million per megawatt. Even older Ampere and Hopper capacity saw pricing rise 30% to 50% quarter over quarter. 

The demand behind those prices is substantial, with CoreWeave reporting 1.7 gigawatts of active power and 4.6 gigawatts of contracted power at September 30, while management put qualified demand through 2027 at roughly ten times available capacity. Managed Inference has also surpassed $250 million in booked ARR, and 70% of new cloud customers added in Q3 were already Forge customers.

The Old GPU Fleet Could Deliver Another Growth Cycle

The bigger opportunity may come from infrastructure that CoreWeave has already deployed, with more than 130,000 GPUs due to come off contract in 2027 and another 170,000 in 2028. Management estimates that recontracting the 2027 fleet could generate nearly $4 billion in incremental annualized revenue, rising to almost $10 billion when the 2028 GPUs are included.

The economics could be attractive because the infrastructure will have completed its initial financing cycle, with management explaining that the delayed-draw loans funding long-term contracts are repaid by the time those contracts end. CoreWeave could then earn another round of revenue from the same GPUs without repeating the original investment in hardware and data-center construction.

The company is already collecting commitments tied to this strategy, expecting approximately $9 billion in customer prepayments and deposits over the next three months, including more than $3 billion connected to recontracting existing infrastructure that requires no additional CapEx. Management also reported that pricing for older-generation GPUs is rising, giving the installed fleet a chance to remain productive beyond its initial contracts.

Those projections still depend on CoreWeave retaining customers, keeping older GPUs competitive and securing renewals at the prices management expects. The nearly $4 billion and $10 billion figures are potential annualized revenue, not guaranteed profit or free cash flow, and operating costs will continue even after the original financing has been repaid.

The Cost Of Building This Cloud Remains Enormous

The company spent $14.5 billion on capital expenditures in Q3 and raised its FY2026 CapEx outlook to $37–$39 billion, while interest expense reached $846 million, compared with $310 million a year earlier. Management expects another $1.05 – $1.15 billion in interest expense in Q4, and GAAP net loss widened to $709 million. 

Management expects customer contracts, prepayments, asset-level loans and operating cash flow to fund most of the buildout, supported by $6.5 billion in cash, restricted cash and marketable securities and nearly $5 billion in undrawn delayed-draw facilities. Full-year revenue guidance now stands at $13–$13.3 billion, with adjusted operating income of $1.27–$1.375 billion and exiting annualized run-rate revenue of $20–$21 billion. 

CRWV Stock Still Has A Damaged Chart

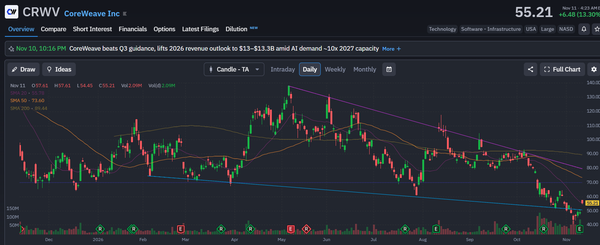
The earnings report sparked a 13.3% rally to $55.21, but the move has yet to repair the larger technical picture, with CRWV still below its 20-day moving average at $55.78, its 50-day at $73.60 and its 200-day at $89.44. The stock has also fallen beneath the marked $70 support area and remains under a descending trendline drawn from its May peak near $137.

Buyers first need to reclaim the 20-day average and hold above it, followed by a recovery through $70. The 50-day average remains a much higher hurdle, and the earnings-session jump alone does not establish a reversal of the broader downtrend.
coreweave - StockEarnings

What’s Next For CoreWeave’s Economics?

CoreWeave’s installed GPU fleet gives the company a credible route to generating another cycle of revenue from infrastructure whose original financing has been repaid. Combined with rising prices, a record backlog, and expanding operating margins, that gives me a bullish view of the underlying business. The renewal opportunity could also reduce the amount of fresh capital required to support future growth.

But I would not call CRWV stock a buy on this chart yet. The share price remains well below its major moving averages, while interest expense and capital spending continue to place a heavy burden on the business. I want to see the renewal economics appear in reported cash generation and the stock reclaim key resistance before treating the earnings rally as the start of a sustained recovery.


Join over 1.2M+ investors/traders who receive daily and weekly notable earnings alerts with predicted move