ajax loader

Loading...


Ride-the-Wave Strategy – Best for Stock Traders

Ride-the-Wave targets multi-day price momentum following a company’s earnings announcement (EA). With this strategy:

  1. Buy a stock one day post-EA if a stock reacts positively post-earnings:
    1. Near the close of trading the EA-day for a pre-market-EA
    2. Near the close of the following day for a post-market-EA
  2. Sell-to-close after 7-10 days, or possibly earlier if a desired price target is reached

Similarly,

  1. short a stock one day post-EA if a stock reacts negatively post-earnings:
    1. near the close of trading the EA-day for a premarket-EA
    2. near the close of the following day for a post-market-EA
  2. then buy-to-close after 7-10 days, or possibly earlier if a desired price target is reached

Important: Ride-the-Wave is predicated on significant price momentum triggered by an EA. The 7-10 day scenario is the maximum trade hold-time. If you see post EA-momentum is halted or reversed by a significant opposite move, re-evaluate your presence in the trade.

This popular StockEarnings screen below will give you a list of stocks that historically exhibit significant price momentum following an EA for the next seven days:

  1. Stocks exhibiting positive post-EA price moves are buy-candidates
  2. Stocks exhibiting negative post-EA price moves are sell/short-candidates

The screen includes those stocks whose Earnings just came out in last two days.

Screen criteria:

  1. Earnings Date Start Date : Current Date + -1 Day
  2. Earnings Date End Date : Current Date + -2 Days
  3. Predicted Move (Next Day) Max : 7%
  4. Predicted Move (On 7th Day) Min : 7%

Strategy Guideline:

  1. Buy the stock if stock has reacted positively. Short the stock if stock has reacted negatively (see above).
  2. Close the position in 7-10 days, or possibly earlier based on price move.

Volatility Crush Strategy - Best for Options Traders

The Volatility Crush strategy is used with stocks that typically experience relatively low-to-moderate price moves (≤4%) following their Earnings Announcements (EA). The basic trade idea is to sell put or call options right before the EA, collecting a credit when options premium is very high due to elevated implied volatility (IV). You then close the position right after the EA by buying the option back much cheaper due to the significant drop in IV that occurs after the mystery of the EA disappears. In assessing this trade, you need to do your homework to ensure you collect sufficient premium to make the trade worthwhile.

This trade is practical due to the low-to-moderate price-move after the EA, which generally won’t significantly affect the options price, unlike an “action” stock, which experience great price moves post-EA. With these symbols, if you’re on the right side of the price move, that’s a great thing. But if you’re on the wrong side of the move, not so great. Consequently, by minimizing the effect of the post-EA price move, you have a much better chance to profit from the reduction in IV without it being ruined by a violent price move.

For this trade, open the position either (1) the night before the EA when the company announces earnings or (2) during the EA day when it announces post-market, generally capturing IV at or close to its peak.

For this trade, open the position either (1) the night before the EA when the company announces earnings or (2) during the EA day when it announces post-market, generally capturing IV at or close to its peak.

This popular stockearnings screen will give you a list of stocks which do not react more than 4% fpost-EA. It includes only those stocks whose earnings are releasing next day.

Screen criteria:

  1. Earnings Date Start Date : Current Date + 1
  2. Earnings Date End Date : Current Date + 1
  3. Predicted Move (Next Day) Max : 4%
  4. Options Type: Weekly

Strategy Guideline:

  1. Options Strategy: Sell Call and Put
  2. Options Strike Price: Current Stock Price – (% Predicated Move x 2)
  3. Expiration Date: It should generally be the closest expiry immediately after the EA.
  4. Buy Insurance: Buying back Call and Put at Strike price which 10% lower than Sell Strike Price is optional but recommended.

Watch Video for More Detail

Volatility Rush Strategy - Best for Options Traders

The Volatility Rush takes advantage of increasing options premiums into earnings announcements (EA) caused by an anticipated rise in Implied Volatility (IV). With this strategy, Buy a Call and Put at-the-money (a long straddle) 2-3 weeks before the EA when IV is lower. Sell the position either (1) the night before the EA when the company announces earnings pre-market, or (2) during the EA day when it announces post-market, generally capturing IV at or close to its peak.

This popular screen will give you a list of stocks whose Options premiums tend to rise into Earnings. It includes only those stocks whose Earnings are at least two weeks away from today.

Screen criteria:

  1. Earnings Date Start Date : Current Date + 15 Days
  2. Earnings Date End Date : Current Date + 30 Days
  3. Predicted Move (Next Day) Min : 5%
  4. Options Type: Weekly or Monthly if that lines up with the two to three-week lead-time for entering the trade

Strategy Guideline:

  1. Buy a Straddle at or close to the money two to three weeks pre-EA.
  2. Sell the position either the night before the EA when the company announces earnings pre-market, or during the EA day when it announces post-market.
  3. Expiration date should generally be the closest expiry immediately after the EA.
  4. Straddle price should not be more 60% of predicted move.

Predicted Move (Volatility)

Similar to Implied Volatility in Options. Expected volatility % based on our Proprietary Volatility Predication Model. We are expecting that stock price will likely to reach % in either direction by the end of next trading session after Earnings are released and not necessarily the closing volatility %.

Why is it important?

    This indicator helps

  1. Knowing expected volatility in stocks after Earnings helps to decide trading stocks before Earnings Announcement.
  2. Taking Advantage of volatility collapse following Earnings Results by using Advance Options strategies such as Spread and Straddles.

Since Last Earnings

Change in share price since last Earnings release.

Why is it Important?

When share has gained more than 10% since it's last Earning release, it tends to over react to minor bad news and give up some gains if not all. So, it contains more downside volatility than upside When share has dropped more than 10% since it's last Earning release, it tends to over react to minor good news and recover some drops if not all. So, it contains more upside volatility than downside.

EPS Surprise (%)

Occurs when a company's reported quarterly or annual profits are above or below analysts' expectations. Here is the formula to derive % EPS Surprice:

Actual EPS - Estimated EPS
------------------------------------- x 100
Estimated EPS

Why is it Important?

Earnings surprises can have a huge impact on a company's stock price. Several studies suggest that positive earnings surprises not only lead to an immediate hike in a stock's price, but also to a gradual increase over time. Hence, it's not surprising that some companies are known for routinely beating earning projections. A negative earnings surprise will usually result in a decline in share price.

Next Day Price Change (%)

Next Regular trading session Closing price following Earnings result.

For After Market Close Earnings, It is a next trading day closing price. For Before Market Open Earnings, It is the same trading day closing price.

Why is it Important?

Next Day price change is a reaction of Earnings result.

VRT Stock: A Quick Options Trade With 163% Upside Potential

Posted on Nov 11, 2026 by Joshua Enomoto

VRT Stock: A Quick Options Trade With 163% Upside Potential

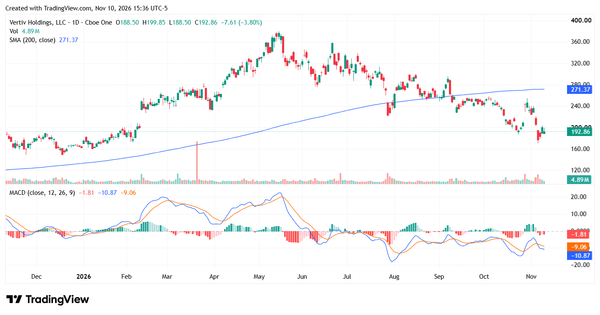
If you’re looking for a quick, aggressive scalp, something that provides a play on current momentum, you may consider AI infrastructure specialist Vertiv Holdings (NYSE: VRT). Primarily, the premise is straightforward contrarianism. Over the trailing month, VRT stock has suffered heavy losses, down 16.25%. However, it’s an extremely relevant company, especially because of the push toward machine intelligence. As such, there’s a plausible recovery angle here.

In fact, it’s so plausible that the recovery has already begun. On the Monday session, Vertiv stock swung up by $17.65 or a jump of 9.65% over the Friday session. That’s both good news and bad news. Sure, VRT is clearly in the midst of robust momentum — and potentially, strength may beget strength. At the same time, there’s that fear of holding the bag.

Translation? VRT stock is incredibly speculative. Further, when the market appears predictable, Murphy’s law suggests that you’re about to find out the hard way that Wall Street plays by no rules but its own. Still, this is where the beauty of options trading comes into play.
vrt stock - StockEarnings

We don’t necessarily need Vertiv stock to catalyze another wholesale rally. With the underlying leverage, a relatively small move (in the right direction) can generate massive payouts. Moreover, there’s compelling evidence that one particular trade — the 215/220 bull call spread expiring Nov. 20 — could be underpriced.

To be fair, the above spread looks like any other multi-leg options strategy. You just have to be willing to read between the lines to see the potential opportunity.

Why Consider the VRT Stock Bull Spread in the First Place?


The first order of business is addressing the elephant in the room. At the time of writing, Vertiv stock trades hands at $200.47. That’s going to be our reference point. For the November monthly bull spread to be fully profitable, VRT must trigger the $220 strike price on expiration. However, that target is currently 9.74% above our position.

You can see the immediate challenge. VRT stock has already gained almost 10% on Monday. What are the chances, then, that it can net another 10% without incurring some heavy drawdowns prior to expiration? If you thought that the odds are slim, you’d be right.

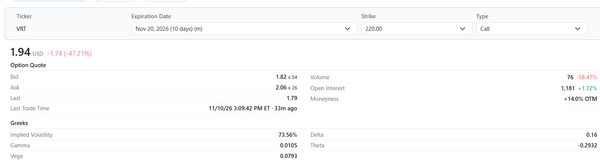
Obviously, no one knows what the future will bring. What we do know are the basics: the current spot price, the distance to the target price, and the days to expiration (which is about a week-and-a-half from now). We also know the current implied volatility (IV) stands at 76.83%.

These stats tell us the qualifying information to make the bull spread profitable. Whether it will be profitable is another question, as we don’t know the probability of which direction VRT stock will take. In order to make an educated guess, we must work with an initial assumption or model.

As a gold standard, Wall Street assumes that the target security will undergo a random walk between now and the expiration date. Further, the IV metaphorically represents the speed of the walking steps. Essentially, this random-walk calculation forms the backbone of Black-Scholes-based options pricing models.

Under this assumption, we may calculate that the odds of Vertiv stock randomly terminating at $75 on the Nov. 20 expiration date sit at 23.47%. So, if you were thinking that it’s unlikely for VRT to rise 10% to hit the necessary strike within the allotted time, you’d be right.

Now, if you were to straight up buy a naked call option (as opposed to a bull call spread), your actual target would be the $220 strike plus the entire premium paid for the naked call. However, with a bull spread, you’re simultaneously selling a call, thus reducing the cash outlay required.

Such a transactional structure helps mitigate the necessary percentage gain to make your trade profitable.

Addressing the Rationality Behind the Speculation

While a bull spread may be the preferred choice for attacking the $220 target of VRT stock, understanding the transaction doesn’t help us justify the trade itself. In other words, how do we know that Vertiv will actually move in the direction we want?

Again, it must be reiterated that no one knows the future. What we just calculated is that Vertiv stock only has a 23.47% chance of being fully profitable, but that might not be the full story. This ratio is what I would call the “journalistic probability” — it’s the consensus assuming that VRT stock will trade under the random walk assumption.

The key word here is “assumption.” There’s no law of nature that forces VRT stock to trade randomly. Indeed, our observation of historical data suggests that under certain circumstances, VRT typically undergoes a nonrandom walk.

Specifically, we can run algorithms to uncover an underappreciated fact. When the balance of weekly candlesticks becomes biased heavily toward the downside over a rolling 10-week period, the subsequent 10-week period tends to feature a recovery play. With VRT stock, we have witnessed the printing of only three down weeks over the past 10 weeks.
vrt stock - StockEarnings
Source: Optioncharts.io

While it’s not a guaranteed inference, this nonrandom transition from a deeply bearish state to a potentially bullish state implies a probabilistic range between 35% and 45% that VRT stock may trigger the $220 strike over the next two weeks.If we assume that the actual probability will land at 42%, the expected value (EV) calculation of the November monthly bull spread — which requires a net debit of $190 for the chance to generate a maximum payout of over 163% — would come out to $20. This translates to a return on capital (ROC) of +10.53%.

Taking Advantage of the Mispricing of Vertiv Stock

In all fairness, an ROC of 10.53% may not be the most compelling idea to consider. However, bull spreads are basically offered by the market because the credit sellers believe it’s a relatively easy way to collect income. Stated differently, you should assume that, as a debit buyer, you’re walking into a disadvantageous deal.

But the difference with the 215/220 bull call spread expiring Nov. 20 is that I believe the debit buyer may have the advantage. Under a nonrandom-walk assumption and given the basic stats mentioned earlier, the EV for the trade is theoretically positive in your favor.

Of course, this all assumes that the non-random walk is the most appropriate/accurate model for VRT stock. If it is, this speculative trade deserves a closer look.


Joshua Enomoto is a seasoned financial writer with a strong track record of in-depth stock analysis, offering clear, insightful commentary for retail investors across all levels of expertise. Renowned for his ability to blend analytical rigor with engaging wit, Joshua's work has been featured on leading investment platforms, including TipRanks, InvestorPlace, Barchart, Benzinga, and Fintel. He was also handpicked to spearhead high-impact initiatives such as InvestorPlace's "Trade of the Day" and Benzinga’s ETF coverage. As a frequent guest expert for CGTN America, Joshua discusses a wide range of economic, societal, and consumer market trends. A graduate of U.C. San Diego, Joshua brings a thoughtful and fresh perspective to complex financial narratives, helping enterprise clients connect with their audiences. He also composes music in his spare time.

Join over 1.2M+ investors/traders who receive daily and weekly notable earnings alerts with predicted move