ajax loader

Loading...


Ride-the-Wave Strategy – Best for Stock Traders

Ride-the-Wave targets multi-day price momentum following a company’s earnings announcement (EA). With this strategy:

  1. Buy a stock one day post-EA if a stock reacts positively post-earnings:
    1. Near the close of trading the EA-day for a pre-market-EA
    2. Near the close of the following day for a post-market-EA
  2. Sell-to-close after 7-10 days, or possibly earlier if a desired price target is reached

Similarly,

  1. short a stock one day post-EA if a stock reacts negatively post-earnings:
    1. near the close of trading the EA-day for a premarket-EA
    2. near the close of the following day for a post-market-EA
  2. then buy-to-close after 7-10 days, or possibly earlier if a desired price target is reached

Important: Ride-the-Wave is predicated on significant price momentum triggered by an EA. The 7-10 day scenario is the maximum trade hold-time. If you see post EA-momentum is halted or reversed by a significant opposite move, re-evaluate your presence in the trade.

This popular StockEarnings screen below will give you a list of stocks that historically exhibit significant price momentum following an EA for the next seven days:

  1. Stocks exhibiting positive post-EA price moves are buy-candidates
  2. Stocks exhibiting negative post-EA price moves are sell/short-candidates

The screen includes those stocks whose Earnings just came out in last two days.

Screen criteria:

  1. Earnings Date Start Date : Current Date + -1 Day
  2. Earnings Date End Date : Current Date + -2 Days
  3. Predicted Move (Next Day) Max : 7%
  4. Predicted Move (On 7th Day) Min : 7%

Strategy Guideline:

  1. Buy the stock if stock has reacted positively. Short the stock if stock has reacted negatively (see above).
  2. Close the position in 7-10 days, or possibly earlier based on price move.

Volatility Crush Strategy - Best for Options Traders

The Volatility Crush strategy is used with stocks that typically experience relatively low-to-moderate price moves (≤4%) following their Earnings Announcements (EA). The basic trade idea is to sell put or call options right before the EA, collecting a credit when options premium is very high due to elevated implied volatility (IV). You then close the position right after the EA by buying the option back much cheaper due to the significant drop in IV that occurs after the mystery of the EA disappears. In assessing this trade, you need to do your homework to ensure you collect sufficient premium to make the trade worthwhile.

This trade is practical due to the low-to-moderate price-move after the EA, which generally won’t significantly affect the options price, unlike an “action” stock, which experience great price moves post-EA. With these symbols, if you’re on the right side of the price move, that’s a great thing. But if you’re on the wrong side of the move, not so great. Consequently, by minimizing the effect of the post-EA price move, you have a much better chance to profit from the reduction in IV without it being ruined by a violent price move.

For this trade, open the position either (1) the night before the EA when the company announces earnings or (2) during the EA day when it announces post-market, generally capturing IV at or close to its peak.

For this trade, open the position either (1) the night before the EA when the company announces earnings or (2) during the EA day when it announces post-market, generally capturing IV at or close to its peak.

This popular stockearnings screen will give you a list of stocks which do not react more than 4% fpost-EA. It includes only those stocks whose earnings are releasing next day.

Screen criteria:

  1. Earnings Date Start Date : Current Date + 1
  2. Earnings Date End Date : Current Date + 1
  3. Predicted Move (Next Day) Max : 4%
  4. Options Type: Weekly

Strategy Guideline:

  1. Options Strategy: Sell Call and Put
  2. Options Strike Price: Current Stock Price – (% Predicated Move x 2)
  3. Expiration Date: It should generally be the closest expiry immediately after the EA.
  4. Buy Insurance: Buying back Call and Put at Strike price which 10% lower than Sell Strike Price is optional but recommended.

Watch Video for More Detail

Volatility Rush Strategy - Best for Options Traders

The Volatility Rush takes advantage of increasing options premiums into earnings announcements (EA) caused by an anticipated rise in Implied Volatility (IV). With this strategy, Buy a Call and Put at-the-money (a long straddle) 2-3 weeks before the EA when IV is lower. Sell the position either (1) the night before the EA when the company announces earnings pre-market, or (2) during the EA day when it announces post-market, generally capturing IV at or close to its peak.

This popular screen will give you a list of stocks whose Options premiums tend to rise into Earnings. It includes only those stocks whose Earnings are at least two weeks away from today.

Screen criteria:

  1. Earnings Date Start Date : Current Date + 15 Days
  2. Earnings Date End Date : Current Date + 30 Days
  3. Predicted Move (Next Day) Min : 5%
  4. Options Type: Weekly or Monthly if that lines up with the two to three-week lead-time for entering the trade

Strategy Guideline:

  1. Buy a Straddle at or close to the money two to three weeks pre-EA.
  2. Sell the position either the night before the EA when the company announces earnings pre-market, or during the EA day when it announces post-market.
  3. Expiration date should generally be the closest expiry immediately after the EA.
  4. Straddle price should not be more 60% of predicted move.

Predicted Move (Volatility)

Similar to Implied Volatility in Options. Expected volatility % based on our Proprietary Volatility Predication Model. We are expecting that stock price will likely to reach % in either direction by the end of next trading session after Earnings are released and not necessarily the closing volatility %.

Why is it important?

    This indicator helps

  1. Knowing expected volatility in stocks after Earnings helps to decide trading stocks before Earnings Announcement.
  2. Taking Advantage of volatility collapse following Earnings Results by using Advance Options strategies such as Spread and Straddles.

Since Last Earnings

Change in share price since last Earnings release.

Why is it Important?

When share has gained more than 10% since it's last Earning release, it tends to over react to minor bad news and give up some gains if not all. So, it contains more downside volatility than upside When share has dropped more than 10% since it's last Earning release, it tends to over react to minor good news and recover some drops if not all. So, it contains more upside volatility than downside.

EPS Surprise (%)

Occurs when a company's reported quarterly or annual profits are above or below analysts' expectations. Here is the formula to derive % EPS Surprice:

Actual EPS - Estimated EPS
------------------------------------- x 100
Estimated EPS

Why is it Important?

Earnings surprises can have a huge impact on a company's stock price. Several studies suggest that positive earnings surprises not only lead to an immediate hike in a stock's price, but also to a gradual increase over time. Hence, it's not surprising that some companies are known for routinely beating earning projections. A negative earnings surprise will usually result in a decline in share price.

Next Day Price Change (%)

Next Regular trading session Closing price following Earnings result.

For After Market Close Earnings, It is a next trading day closing price. For Before Market Open Earnings, It is the same trading day closing price.

Why is it Important?

Next Day price change is a reaction of Earnings result.

Big Bank Earnings Winners and Losers: Why the Market Got It Half Right

Posted on Oct 16, 2026 by Chris Markoch

Big Bank Earnings Winners and Losers: Why the Market Got It Half Right

Big bank earnings season is underway, and the scorecard is messier than the headlines suggest. Bank stocks came into the week under pressure. The Invesco KBW Bank ETF (NASDAQ: KBWB) was roughly 12% below its mid-August peak while the S&P 500 and Nasdaq were hitting records. Climbing bond yields and worries about funding costs were weighing on the group.

The big bank earnings that followed didn’t always match that gloomy mood. Several banks beat estimates and still sold off. One missed and barely flinched. That gap between perception and fundamentals is where investors should focus.

Here’s how I see the winners and losers. Goldman Sachs (NYSE: GS), Morgan Stanley (NYSE: MS), and JPMorgan Chase (NYSE: JPM) delivered results that strengthen their long-term stories. Bank of America (NYSE: BAC) stands alone as the loser. Its problems are partly self-inflicted and partly structural.

The sell-off of Citigroup (NYSE: C) deserves a closer look too. But a falling stock price doesn’t automatically make a bank a loser.

Big Bank Earnings Winner: Goldman Sachs


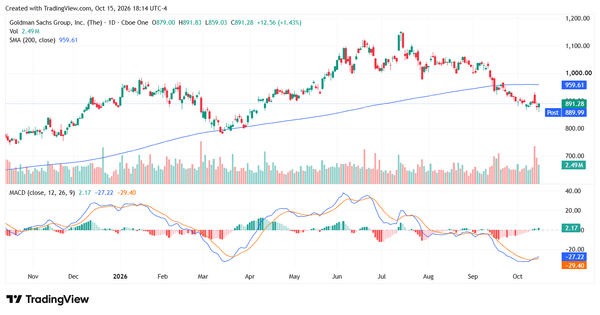
Goldman Sachs set the tone on Tuesday. The firm posted diluted EPS of $17.01, well above the $13.65 consensus. Revenue rose 23% from a year earlier to $18.68 billion.

Equities trading was the engine. Equities revenue jumped 72% to $6.44 billion as volatile markets kept clients repositioning. Investment banking also beat, with segment revenue of $3.23 billion against estimates of $2.86 billion.

There were soft spots. Fixed income, currency, and commodities revenue was essentially flat at $3.47 billion. EPS also fell from $20.98 in the second quarter.

Still, Goldman is investing in its next leg of growth. It agreed to buy NEOS Investments and LCN Capital Partners to expand its alternatives platform. It also returned $4.49 billion to common shareholders. Shares moved higher after the report. That reaction looks justified.
big bank earnings - StockEarnings

Big Bank Earnings Winner: Morgan Stanley

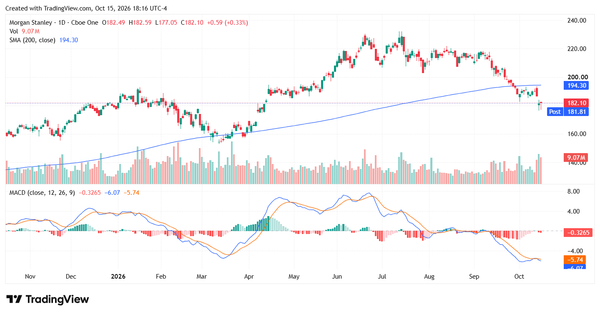
Morgan Stanley may be the week’s most underappreciated winner. EPS of $3.03 beat the LSEG consensus of $2.91. Net revenue rose 12% to $20.34 billion.

Wealth management is the reason to own this stock. The division posted record revenue of $9.1 billion and record pretax profit of $2.8 billion. Net new assets hit a record $232 billion. Total client assets across wealth and investment management climbed by nearly $400 billion to a record $10.5 trillion.

The institutional side held up too. Equities revenue surged 41% year over year. Return on tangible common equity was 22.6%, the fifth straight quarter above 20%.

So why did shares fall more than 3%? Investors focused on softer fixed income and investment banking, plus a carry reversal in investment management. That’s perception overriding fundamentals. One fair caution: just over half of the net new assets were tied to IPOs. Those flows can ebb. But a record asset base generates recurring fees regardless of trading conditions.
big bank earnings - StockEarnings

Big Bank Earnings Winner: JPMorgan Chase

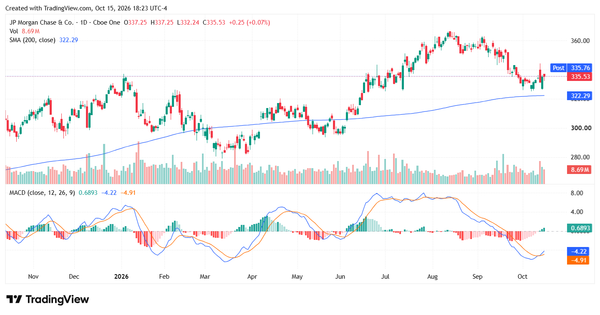
Calling JPMorgan Chase a winner requires some explanation. The bank posted its first quarterly earnings miss since the fourth quarter of 2023. EPS of $5.57 came in below the $5.85 LSEG consensus.

Context matters. The shortfall partly reflected $658 million in investment securities losses, worth about $0.18 per share after tax. Excluding that, EPS was $5.75, still a miss. But a narrow one.

The core engine is accelerating. Net interest income climbed 13% to $27.1 billion. Full-year 2026 NII guidance rose to about $106.2 billion from $105.5 billion. Management also floated a 2027 NII outlook near $107 billion. Return on tangible common equity of 20% beat the 17% through-cycle target.

The market got this one right. Shares reversed a 3% premarket drop and traded higher after the open. Investors looked past volatile trading lines and paid for durable lending income. The risk to watch is capital return. Net common stock repurchases were just $664 million this quarter.
big bank earnings - StockEarnings

Big Bank Earnings Loser: Bank of America

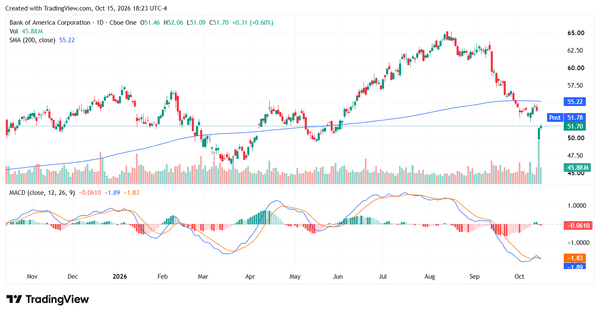
Bank of America is the clear loser of big bank earnings season so far. Adjusted EPS of $1.08 missed the $1.10 consensus. Revenue of $29.96 billion fell short of the $30.56 billion estimate.

Headline results looked worse. A $1.2 billion regulatory charge tied to Bank Secrecy Act and anti-money laundering consent orders cut $0.17 from EPS. GAAP EPS dropped to $0.91. Net income fell to $6.9 billion from $8.3 billion a year earlier.

The capital markets business is the deeper problem. FICC revenue fell 17% to $2.6 billion. Investment banking fees declined 11% to $1.8 billion. Rivals rode a trading boom. Bank of America largely missed it.

Investors had fair warning. In September, CEO Brian Moynihan guided to flat trading revenue and lower banking fees. The stock fell about 5% that day. It dropped again on the actual report.

The banking franchise isn’t broken. Net interest income rose 8% to $16.4 billion. Management guided to 2027 NII growth of 8% or more. That’s real, but it isn’t enough to change the narrative right now.
big bank earnings - StockEarnings

What About Citigroup?

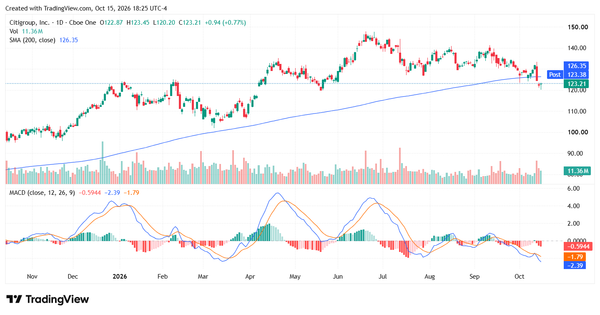
Citigroup is the hardest call, and I don’t think it belongs in the loser column. The stock fell about 5.6% on Tuesday despite an earnings beat. The results didn’t justify that.

Citi earned $2.85 per share against a $2.65 consensus, on its strongest third-quarter revenue in a decade. Revenue rose 8% to $23.85 billion. Management raised the dividend 12% and expects to exceed its 2026 return target.

The selloff likely reflects worries about seasonally weaker second-half trading and rising investment spending. That’s a perception problem, not a fundamentals problem. For contrarian investors, Citi may be the most interesting setup of the week.
big bank earnings - StockEarnings

How to Position Your Portfolio After Big Bank Earnings

This round of big bank earnings separated diversified franchises from banks leaning on a single engine. Goldman and Morgan Stanley captured the equities boom. JPMorgan proved its lending machine can carry a soft trading quarter.

Bank of America lacked both advantages this quarter. Investors punished it accordingly.

The bigger lesson is about reactions. Morgan Stanley and Citigroup sold off on strong results. When price action and fundamentals diverge this sharply, fundamentals usually win over time.


A former marketing copywriter turned freelance financial writer and market analyst. I have a passion for delivering insights to investors. I write regularly about stocks for StockEarnings and MarketBeat. Posts are not advice.

Join over 1.2M+ investors/traders who receive daily and weekly notable earnings alerts with predicted move