Given the unusual nature of using Markov chains to estimate forward valuation trajectories, my recent article about Arm Holdings (NASDAQ: ARM) may have generated skepticism. At the end of last month, I stated that ARM stock represented a high-risk gamble that could nevertheless pay off handsomely for speculative options traders.
Sure, any options-based wager — especially one on a semiconductor company — may arouse framing reminiscent of a slot machine. But the idea that I discussed, which was the 300/310 bull call spread expiring Sep. 18, seemed particularly outrageous. On the publication date of July 31, ARM stock closed at $239.69. As such, the ticker would need to soar over 29% to be fully profitable.
Adding insult to injury, the breakeven price for the above call spread (at the time of writing) was $304.30. That would mean Arm Holdings stock would need to rise almost 27% just for the trade not to lose money. So, it’s no surprise that Wall Street had assigned a low probability of profit of only 35.8%.
Based on the signals that the market was providing, those low odds were justified. When the semiconductor company released its first-quarter results on July 29, investors weren’t impressed, despite earnings per share of 45 cents on revenue of $1.29 billion exceeding analysts’ consensus targets. Likely, trading algorithms locked onto the tempered full-year smartphone royalty guidance.
However, the market zeroed in on cumulative customer demand for ARM’s new AI data center chip, which surpassed $2 billion across fiscal years 2027 and 2028 — more than double the previous $1 billion outlook. Essentially, that was a human digestion of data, meaning that the machines don’t always get it right. As such, ARM stock jumped 17.36% to $280.56.
Still, the point I’d like to stress is that prior to this digestion, I had argued for a higher probability of profit for an aggressive bull call spread. Even better, this opinion didn’t arise from a whim. I shared my thought process last week.
Order Flow Imbalance Tipped Off ARM Stock
As I stated in the StockEarnings article, Arm Holdings stock had previously printed only four up weeks across the last 10 weeks, leading to an overall downward slope. Under this 4-6-D quantitative sequence, the historical response has been for the ticker to rise dramatically higher.
Now, I don’t want to go through line by line what I explained — you can read the article yourself at your leisure. But the basic point I was making was that, at a specific point in time (i.e. the Sep. 18 expiration date), the median endpoint outcome for ARM stock implied that the 300/310 bull spread represented a reasonable idea.
By “reasonable”, I am of course referring to the assumptions laid out by the Markov simulation that I ran. To be 100% clear, I’m not suggesting that my model is the ultimate arbiter of truth. Frankly, I cannot ever say with absolute certainty what will happen in the future. That said, I do know what has previously happened when a specific quant phenomenon has materialized.
If we therefore assume that this same median trend will play out, the Sep. 18 300/310 bull spread seems reasonable.
Now, it should be stated that there’s no universal law to declare that a 10-week quant sequence has a special, probabilistic power in the market. At the end of the day, it is an arbitrary, numerical presupposition. However, all arguments require a presupposition (in finance, we would call this an axiom) to begin the analysis.
From a philosophical standpoint, what I’m saying is that given Arm Holdings stock was structured in a specific quant sequence, we can use past data to inductively project where the ticker may land next at some specified point in time. In this case, the historical outcome that followed the 4-6-D signal suggested that the 300/310 bull spread was in play.
A Nonrandom Walk Was on the Horizon
Another point that I’d like to stress is that Wall Street’s 35.8% probability of profit was derived using the Black-Scholes family of options-pricing formulas. At the heart of the model is a question: given the perceived future risk of Arm Holdings stock options, what is a fair price to pay today?
I want you to realize that “perceived future risk” is doing a lot of work. The reason why ARM stock call spreads featuring a breakeven price of $304.30 were priced the way they were on July 31 came down to the low odds that the underlying trade would not lose money. But how did the Street arrive at the 35.8% figure?
Essentially, this is the implied probability of Arm Holdings stock moving from the current spot price to the target threshold if it took a random walk over the assigned time period. Under this random environment, if you bet on this trade across a hundred parallel universes, you’d be expected to break even about 36 times.
What I was pointing out in my StockEarnings article was that under 4-6-D conditions, the expected trajectory over the next 10 weeks tends to exhibit a nonrandom walk. Indeed, the argument was that instead of a walk, it would jump — a concept known as a volatility cluster.
On the flipside, Black-Scholes can’t forecast a volatility cluster because it’s a static formula. As elegant as the mathematics undergirding the formula is, it will always spit out a number that reflects the parameters of the model. A formula cannot go outside of itself. Thus, it was structurally incapable of giving any other probability other than 35.8%.
However, my thesis was that under certain quantitative conditions, you should not assume that Arm Holdings stock will traverse along a random walk. Instead, as Tuesday’s dramatic swing higher demonstrated, the ticker enjoyed a positive nonrandom move.
To be fair, we’re still a bit removed from the $310 strike that needs to be triggered. But we’re now much closer to the promised land. What’s more, the Street has bumped up the probability of profit for the aforementioned call spread to 39.4%. As a result, I feel justified in calculating a higher probability than what the options market makers were willing to give.
A Second Chance at the Wheel?
Interestingly, as of the latest data stream, ARM stock is quantitatively structured in a 3-7-D sequence. This signal is extraordinarily rare, having only materialized eight times. If the 4-6-D signal suffered from a small sample size, this one is much worse.
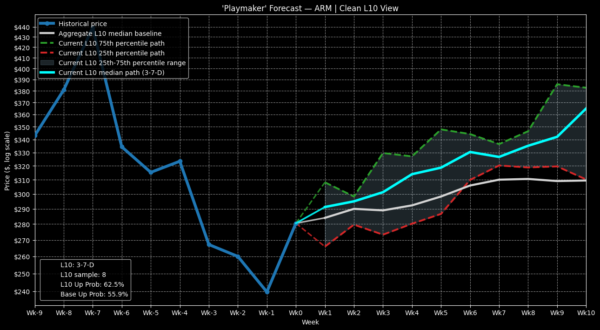
Still, the implications are intriguing. Historically, under this condition, traders have aggressively bid up ARM stock. That means the earlier 300/310 call spread appears very much in play. Of course, the spread now has become more expensive in that you have to pay a sizable amount of net debit for a shrunken reward potential relative to the period before Tuesday’s slingshot move.
For those who are still interested in the trade, you have several ideas to consider. If you’re targeting the Sep. 18 model, bull spreads featuring a second-leg strike between $300 up to $330 could be plausible, depending on your risk tolerance.
For those who are impatient (and extremely intrepid), the 290/300 bull spread expiring Aug. 21 could be interesting. Here, the breakeven price is listed at $294.55, featuring a probability of profit of 41.1%. Of the eight times that the 3-7-D sequence has flashed, ARM stock has landed above this threshold four times, possibly implying greater odds than what has been declared by Black-Scholes.

