ajax loader

Loading...


Ride-the-Wave Strategy – Best for Stock Traders

Ride-the-Wave targets multi-day price momentum following a company’s earnings announcement (EA). With this strategy:

  1. Buy a stock one day post-EA if a stock reacts positively post-earnings:
    1. Near the close of trading the EA-day for a pre-market-EA
    2. Near the close of the following day for a post-market-EA
  2. Sell-to-close after 7-10 days, or possibly earlier if a desired price target is reached

Similarly,

  1. short a stock one day post-EA if a stock reacts negatively post-earnings:
    1. near the close of trading the EA-day for a premarket-EA
    2. near the close of the following day for a post-market-EA
  2. then buy-to-close after 7-10 days, or possibly earlier if a desired price target is reached

Important: Ride-the-Wave is predicated on significant price momentum triggered by an EA. The 7-10 day scenario is the maximum trade hold-time. If you see post EA-momentum is halted or reversed by a significant opposite move, re-evaluate your presence in the trade.

This popular StockEarnings screen below will give you a list of stocks that historically exhibit significant price momentum following an EA for the next seven days:

  1. Stocks exhibiting positive post-EA price moves are buy-candidates
  2. Stocks exhibiting negative post-EA price moves are sell/short-candidates

The screen includes those stocks whose Earnings just came out in last two days.

Screen criteria:

  1. Earnings Date Start Date : Current Date + -1 Day
  2. Earnings Date End Date : Current Date + -2 Days
  3. Predicted Move (Next Day) Max : 7%
  4. Predicted Move (On 7th Day) Min : 7%

Strategy Guideline:

  1. Buy the stock if stock has reacted positively. Short the stock if stock has reacted negatively (see above).
  2. Close the position in 7-10 days, or possibly earlier based on price move.

Volatility Crush Strategy - Best for Options Traders

The Volatility Crush strategy is used with stocks that typically experience relatively low-to-moderate price moves (≤4%) following their Earnings Announcements (EA). The basic trade idea is to sell put or call options right before the EA, collecting a credit when options premium is very high due to elevated implied volatility (IV). You then close the position right after the EA by buying the option back much cheaper due to the significant drop in IV that occurs after the mystery of the EA disappears. In assessing this trade, you need to do your homework to ensure you collect sufficient premium to make the trade worthwhile.

This trade is practical due to the low-to-moderate price-move after the EA, which generally won’t significantly affect the options price, unlike an “action” stock, which experience great price moves post-EA. With these symbols, if you’re on the right side of the price move, that’s a great thing. But if you’re on the wrong side of the move, not so great. Consequently, by minimizing the effect of the post-EA price move, you have a much better chance to profit from the reduction in IV without it being ruined by a violent price move.

For this trade, open the position either (1) the night before the EA when the company announces earnings or (2) during the EA day when it announces post-market, generally capturing IV at or close to its peak.

For this trade, open the position either (1) the night before the EA when the company announces earnings or (2) during the EA day when it announces post-market, generally capturing IV at or close to its peak.

This popular stockearnings screen will give you a list of stocks which do not react more than 4% fpost-EA. It includes only those stocks whose earnings are releasing next day.

Screen criteria:

  1. Earnings Date Start Date : Current Date + 1
  2. Earnings Date End Date : Current Date + 1
  3. Predicted Move (Next Day) Max : 4%
  4. Options Type: Weekly

Strategy Guideline:

  1. Options Strategy: Sell Call and Put
  2. Options Strike Price: Current Stock Price – (% Predicated Move x 2)
  3. Expiration Date: It should generally be the closest expiry immediately after the EA.
  4. Buy Insurance: Buying back Call and Put at Strike price which 10% lower than Sell Strike Price is optional but recommended.

Watch Video for More Detail

Volatility Rush Strategy - Best for Options Traders

The Volatility Rush takes advantage of increasing options premiums into earnings announcements (EA) caused by an anticipated rise in Implied Volatility (IV). With this strategy, Buy a Call and Put at-the-money (a long straddle) 2-3 weeks before the EA when IV is lower. Sell the position either (1) the night before the EA when the company announces earnings pre-market, or (2) during the EA day when it announces post-market, generally capturing IV at or close to its peak.

This popular screen will give you a list of stocks whose Options premiums tend to rise into Earnings. It includes only those stocks whose Earnings are at least two weeks away from today.

Screen criteria:

  1. Earnings Date Start Date : Current Date + 15 Days
  2. Earnings Date End Date : Current Date + 30 Days
  3. Predicted Move (Next Day) Min : 5%
  4. Options Type: Weekly or Monthly if that lines up with the two to three-week lead-time for entering the trade

Strategy Guideline:

  1. Buy a Straddle at or close to the money two to three weeks pre-EA.
  2. Sell the position either the night before the EA when the company announces earnings pre-market, or during the EA day when it announces post-market.
  3. Expiration date should generally be the closest expiry immediately after the EA.
  4. Straddle price should not be more 60% of predicted move.

Predicted Move (Volatility)

Similar to Implied Volatility in Options. Expected volatility % based on our Proprietary Volatility Predication Model. We are expecting that stock price will likely to reach % in either direction by the end of next trading session after Earnings are released and not necessarily the closing volatility %.

Why is it important?

    This indicator helps

  1. Knowing expected volatility in stocks after Earnings helps to decide trading stocks before Earnings Announcement.
  2. Taking Advantage of volatility collapse following Earnings Results by using Advance Options strategies such as Spread and Straddles.

Since Last Earnings

Change in share price since last Earnings release.

Why is it Important?

When share has gained more than 10% since it's last Earning release, it tends to over react to minor bad news and give up some gains if not all. So, it contains more downside volatility than upside When share has dropped more than 10% since it's last Earning release, it tends to over react to minor good news and recover some drops if not all. So, it contains more upside volatility than downside.

EPS Surprise (%)

Occurs when a company's reported quarterly or annual profits are above or below analysts' expectations. Here is the formula to derive % EPS Surprice:

Actual EPS - Estimated EPS
------------------------------------- x 100
Estimated EPS

Why is it Important?

Earnings surprises can have a huge impact on a company's stock price. Several studies suggest that positive earnings surprises not only lead to an immediate hike in a stock's price, but also to a gradual increase over time. Hence, it's not surprising that some companies are known for routinely beating earning projections. A negative earnings surprise will usually result in a decline in share price.

Next Day Price Change (%)

Next Regular trading session Closing price following Earnings result.

For After Market Close Earnings, It is a next trading day closing price. For Before Market Open Earnings, It is the same trading day closing price.

Why is it Important?

Next Day price change is a reaction of Earnings result.

Here’s How to Possibly Scalp Some Profits Off AST SpaceMobile (ASTS) Stock

Posted on Aug 07, 2026 by Joshua Enomoto

Here’s How to Possibly Scalp Some Profits Off AST SpaceMobile (ASTS) Stock

Thanks to soaring competition in the space economy — thanks in large part to the initial public offering of SpaceX (NASDAQ: SPCX) — it’s been a rough ride for sector players like AST SpaceMobile (NASDAQ: ASTS). However, recent activity in ASTS stock has demonstrated that the satellite designer and manufacturer is still very much in the game.

To be fair, it’s difficult to ignore the overall picture. On a year-to-date basis, ASTS stock has lost nearly 6%. In the past six months, the ticker gave up almost 33% of market value. Such terrible stats have naturally caused many retail traders to sit on the sidelines. At the same, we can’t overlook the trailing-five-day performance (as of the end of Aug. 5) of over 20%.

In hindsight, the upswing may not have been that surprising. We’re still talking about a viable space business in a fast-growing industry. As such, the wave of weak hands leaving the market may have triggered rules-based algorithms to bid up ASTS stock. In fact, that was my argument when I wrote about AST SpaceMobile for another publication.

Now, because the ticker has bounced back so strongly, I’m not entirely sure that there’s another 20% rally left in the tank. However, with ASTS stock achingly close to the psychological price target of $70, I do believe this level may be in play.

Of course, at the time-of-writing price of $68.38, a move to $70 is only 2.37% up. That’s not something to get too excited about. But with the leverage of options — specifically a debit spread — that modest swing may translate to a much more robust reward.

As a speculative idea, I’m looking at the near-term 68/70 bull call spread expiring Aug. 21. Should AST SpaceMobile stock rise through the $70 strike at expiration, the $110 net debit would lead to a $90 profit or a maximum payout of nearly 82%.

Interestingly, the breakeven price for the above call spread is $69.10 and Wall Street isn’t that optimistic that the trade will end in a draw. In fact, the probability of profit is only 48.3%. However, I think there’s an alternative way to calculate these odds.

Understanding the Limitations of Black-Scholes for ASTS Stock


There’s no denying that options math is incredibly complicated. When you hold a common stock, you’re holding a static slice of current equity. In contrast, when you acquire an options contract, you’re holding a time-bound, asymmetric claim on a future probability distribution.

In other words, unlike an equity, which gives you a static ownership slice of an asset’s present value, an option gives you a decaying, conditional contract that monetizes volatility, time and trajectory. You aren’t paying for what the company is today — you’re paying for a leveraged bet on where its price path might land before the clock runs out.

A simple way to look at this confusing picture is that the options market has to have a uniform mechanism to determine what the future perceived risk of that option is and then work backwards to assign you a “fair price” today. However, “perceived risk” is doing a lot of work here.

As mentioned earlier, Wall Street gives us a probability of profit of 48.3% that AST SpaceMobile stock will break even at $69.10 on Aug. 21. But if nobody knows what the future is, how did the market calculate 48.3% odds?

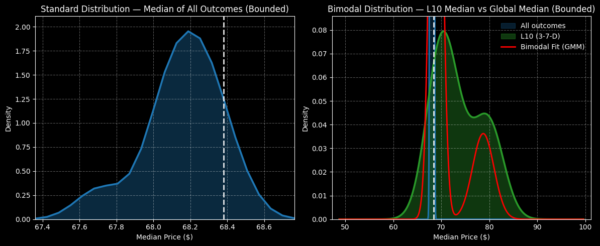
To make a long story short, Black-Scholes assumes that ASTS stock will undergo a random walk between now and the Aug. 21 expiration date. During this random walk, the chance that the ticker will reach $69.10 at expiration is 48.3%.
asts-StockEarnings

Here’s the part that a lot of beginner retail traders don’t often realize: you don’t have to accept Black-Scholes’ implied probability figures as gospel truth. It’s simply a presupposition. Imagine a street preacher corners you and declares that there are only two places you go when you pass on. This is a presupposition — we simply don’t know what lies beyond the paradigm of life, if anything.

Thus, if we have an alternative model — and we happen to give more weight to its presupposition than the one articulated by Black-Scholes — we may be able to uncover a favorable mispricing. That’s my argument for ASTS stock.

Eliciting a Nonrandom Walk for AST SpaceMobile Stock

It’s not that I’m arguing against Black-Scholes for the sake of it. Rather, I’m not entirely convinced that ASTS stock will traverse along a random walk. If anything, the data supports the idea of a nonrandom walk. If so, we need a model that reflects this reality as opposed to Black-Scholes’ artificial construct.

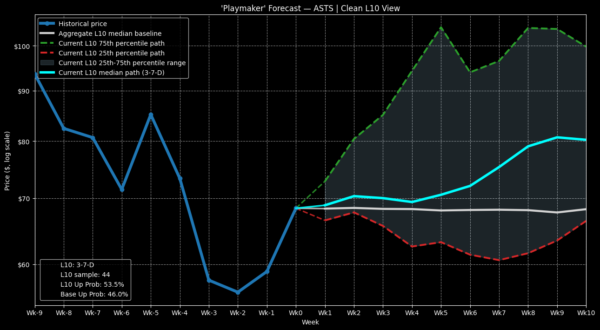
Why do I believe that AST SpaceMobile stock will undergo a nonrandom walk? It’s because of its order flow imbalance. In the last 10 weeks, ASTS stock has only printed three up weeks, leading to a downward slope. While there’s nothing inherently special about this 3-7-D quant signal, whenever it has appeared in the technical charts, ASTS has typically enjoyed an above-average performance.

Before we get too far ahead of ourselves, I’m not guaranteeing that the same trend will materialize in the future. All inductive models face the possibility of running into the black swan risk. A model can consistently work but then the market just might not cooperate. That’s the overriding danger in any options trade.
asts-StockEarnings

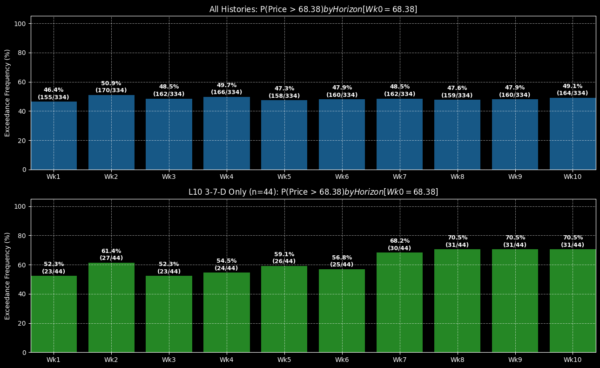
Having said that, under 3-7-D conditions, ASTS stock tends to rise to an equivalent median endpoint of $70 at the end of week 2 (which roughly coincides with the Aug. 21 expiration date). So, the idea is that if you consider the 68/70 bull call spread now, ASTS may have a 50/50 shot at triggering the second-leg strike price at expiration.

However, the mathematically intriguing point is the $69.10 breakeven price. Again, Wall Street believes this threshold only has a 48.3% chance of being triggered. I see things differently, though.

Of the 44 times that the 3-7-D signal has flashed, ASTS stock has reached the equivalent of the $69.10 breakeven price a total of 27 times at the end of week 2. Based on conditional, observed data, the probability of profit may be 61.4%.

Earnings Volatility to Consider

It should be noted that AST SpaceMobile will soon release its quarterly earnings report on Aug. 10. With implied volatility (IV) currently running at nearly 117%, traders should expect potentially large swings. If you’re feeling particularly optimistic about the company’s results, you may decide to raise the second-leg strike of your debit spread.
asts-StockEarnings

I’m not going to sit here and pretend that I know what the results are going to be like. I checked Polymarket in an attempt to discover what the consensus opinion was. Unfortunately, I didn’t find any wagers placed on AST’s projected numbers. Even if we did, it wouldn’t necessarily reflect on how the market may perceive ASTS stock.

With all that said, if we were to look strictly at the implied performance following the 3-7-D signal, the median endpoint price of AST SpaceMobile stock on Aug. 21 is forecasted to be $70. It’s not a guarantee and like any model, there are flaws in my approach. However, if I had to guess where ASTS may end up, I would be tempted to follow where the stock has historically landed.


Joshua Enomoto is a seasoned financial writer with a strong track record of in-depth stock analysis, offering clear, insightful commentary for retail investors across all levels of expertise. Renowned for his ability to blend analytical rigor with engaging wit, Joshua's work has been featured on leading investment platforms, including TipRanks, InvestorPlace, Barchart, Benzinga, and Fintel. He was also handpicked to spearhead high-impact initiatives such as InvestorPlace's "Trade of the Day" and Benzinga’s ETF coverage. As a frequent guest expert for CGTN America, Joshua discusses a wide range of economic, societal, and consumer market trends. A graduate of U.C. San Diego, Joshua brings a thoughtful and fresh perspective to complex financial narratives, helping enterprise clients connect with their audiences. He also composes music in his spare time.

Join over 1.2M+ investors/traders who receive daily and weekly notable earnings alerts with predicted move