ajax loader

Loading...


Ride-the-Wave Strategy – Best for Stock Traders

Ride-the-Wave targets multi-day price momentum following a company’s earnings announcement (EA). With this strategy:

  1. Buy a stock one day post-EA if a stock reacts positively post-earnings:
    1. Near the close of trading the EA-day for a pre-market-EA
    2. Near the close of the following day for a post-market-EA
  2. Sell-to-close after 7-10 days, or possibly earlier if a desired price target is reached

Similarly,

  1. short a stock one day post-EA if a stock reacts negatively post-earnings:
    1. near the close of trading the EA-day for a premarket-EA
    2. near the close of the following day for a post-market-EA
  2. then buy-to-close after 7-10 days, or possibly earlier if a desired price target is reached

Important: Ride-the-Wave is predicated on significant price momentum triggered by an EA. The 7-10 day scenario is the maximum trade hold-time. If you see post EA-momentum is halted or reversed by a significant opposite move, re-evaluate your presence in the trade.

This popular StockEarnings screen below will give you a list of stocks that historically exhibit significant price momentum following an EA for the next seven days:

  1. Stocks exhibiting positive post-EA price moves are buy-candidates
  2. Stocks exhibiting negative post-EA price moves are sell/short-candidates

The screen includes those stocks whose Earnings just came out in last two days.

Screen criteria:

  1. Earnings Date Start Date : Current Date + -1 Day
  2. Earnings Date End Date : Current Date + -2 Days
  3. Predicted Move (Next Day) Max : 7%
  4. Predicted Move (On 7th Day) Min : 7%

Strategy Guideline:

  1. Buy the stock if stock has reacted positively. Short the stock if stock has reacted negatively (see above).
  2. Close the position in 7-10 days, or possibly earlier based on price move.

Volatility Crush Strategy - Best for Options Traders

The Volatility Crush strategy is used with stocks that typically experience relatively low-to-moderate price moves (≤4%) following their Earnings Announcements (EA). The basic trade idea is to sell put or call options right before the EA, collecting a credit when options premium is very high due to elevated implied volatility (IV). You then close the position right after the EA by buying the option back much cheaper due to the significant drop in IV that occurs after the mystery of the EA disappears. In assessing this trade, you need to do your homework to ensure you collect sufficient premium to make the trade worthwhile.

This trade is practical due to the low-to-moderate price-move after the EA, which generally won’t significantly affect the options price, unlike an “action” stock, which experience great price moves post-EA. With these symbols, if you’re on the right side of the price move, that’s a great thing. But if you’re on the wrong side of the move, not so great. Consequently, by minimizing the effect of the post-EA price move, you have a much better chance to profit from the reduction in IV without it being ruined by a violent price move.

For this trade, open the position either (1) the night before the EA when the company announces earnings or (2) during the EA day when it announces post-market, generally capturing IV at or close to its peak.

For this trade, open the position either (1) the night before the EA when the company announces earnings or (2) during the EA day when it announces post-market, generally capturing IV at or close to its peak.

This popular stockearnings screen will give you a list of stocks which do not react more than 4% fpost-EA. It includes only those stocks whose earnings are releasing next day.

Screen criteria:

  1. Earnings Date Start Date : Current Date + 1
  2. Earnings Date End Date : Current Date + 1
  3. Predicted Move (Next Day) Max : 4%
  4. Options Type: Weekly

Strategy Guideline:

  1. Options Strategy: Sell Call and Put
  2. Options Strike Price: Current Stock Price – (% Predicated Move x 2)
  3. Expiration Date: It should generally be the closest expiry immediately after the EA.
  4. Buy Insurance: Buying back Call and Put at Strike price which 10% lower than Sell Strike Price is optional but recommended.

Watch Video for More Detail

Volatility Rush Strategy - Best for Options Traders

The Volatility Rush takes advantage of increasing options premiums into earnings announcements (EA) caused by an anticipated rise in Implied Volatility (IV). With this strategy, Buy a Call and Put at-the-money (a long straddle) 2-3 weeks before the EA when IV is lower. Sell the position either (1) the night before the EA when the company announces earnings pre-market, or (2) during the EA day when it announces post-market, generally capturing IV at or close to its peak.

This popular screen will give you a list of stocks whose Options premiums tend to rise into Earnings. It includes only those stocks whose Earnings are at least two weeks away from today.

Screen criteria:

  1. Earnings Date Start Date : Current Date + 15 Days
  2. Earnings Date End Date : Current Date + 30 Days
  3. Predicted Move (Next Day) Min : 5%
  4. Options Type: Weekly or Monthly if that lines up with the two to three-week lead-time for entering the trade

Strategy Guideline:

  1. Buy a Straddle at or close to the money two to three weeks pre-EA.
  2. Sell the position either the night before the EA when the company announces earnings pre-market, or during the EA day when it announces post-market.
  3. Expiration date should generally be the closest expiry immediately after the EA.
  4. Straddle price should not be more 60% of predicted move.

Predicted Move (Volatility)

Similar to Implied Volatility in Options. Expected volatility % based on our Proprietary Volatility Predication Model. We are expecting that stock price will likely to reach % in either direction by the end of next trading session after Earnings are released and not necessarily the closing volatility %.

Why is it important?

    This indicator helps

  1. Knowing expected volatility in stocks after Earnings helps to decide trading stocks before Earnings Announcement.
  2. Taking Advantage of volatility collapse following Earnings Results by using Advance Options strategies such as Spread and Straddles.

Since Last Earnings

Change in share price since last Earnings release.

Why is it Important?

When share has gained more than 10% since it's last Earning release, it tends to over react to minor bad news and give up some gains if not all. So, it contains more downside volatility than upside When share has dropped more than 10% since it's last Earning release, it tends to over react to minor good news and recover some drops if not all. So, it contains more upside volatility than downside.

EPS Surprise (%)

Occurs when a company's reported quarterly or annual profits are above or below analysts' expectations. Here is the formula to derive % EPS Surprice:

Actual EPS - Estimated EPS
------------------------------------- x 100
Estimated EPS

Why is it Important?

Earnings surprises can have a huge impact on a company's stock price. Several studies suggest that positive earnings surprises not only lead to an immediate hike in a stock's price, but also to a gradual increase over time. Hence, it's not surprising that some companies are known for routinely beating earning projections. A negative earnings surprise will usually result in a decline in share price.

Next Day Price Change (%)

Next Regular trading session Closing price following Earnings result.

For After Market Close Earnings, It is a next trading day closing price. For Before Market Open Earnings, It is the same trading day closing price.

Why is it Important?

Next Day price change is a reaction of Earnings result.

Eli Lilly Crushes Q2 Earnings, Raises Full-Year Outlook

Posted on Aug 07, 2026 by Chris Markoch

Eli Lilly Crushes Q2 Earnings, Raises Full-Year Outlook

Eli Lilly (NYSE: LLY) delivered a second-quarter earnings report, and it’s difficult to find anything to criticize. The pharmaceutical giant beat both revenue and earnings estimates, and shares have climbed approximately 7% in the two trading sessions since the company issued the report on Aug. 4 before the market opened.

The headline numbers speak for themselves. Total revenue reached $23 billion, up 48% year-over-year. Non-GAAP earnings per share came in at $8.38, a 33% increase from the prior-year period. Both figures topped what Wall Street had penciled in heading into the print.

What makes this quarter notable is timing. Lilly is now lapping some of its toughest GLP-1 comparisons yet, as Mounjaro and Zepbound sales exploded a year ago. Growth accelerating anyway, rather than decelerating, tells investors something important about durability.

Beyond the weight-loss and diabetes franchise, Lilly’s broader pipeline is starting to contribute meaningfully. Oncology, immunology, and neuroscience products posted a combined growth of 121%. Management also raised full-year guidance on both revenue and profitability. The stock’s premium valuation increasingly looks justified by execution, not just narrative.

GLP-1 Momentum Shows No Signs of Slowing


The GLP-1 (incretin) franchise remains the engine driving Lilly’s results, and the Q2 numbers made that unmistakably clear. Overall revenue grew 67% year-over-year, fueled by both market expansion and Lilly gaining share from competitors. Mounjaro alone generated $9.9 billion in quarterly sales, up 91% from a year ago. Zepbound added $4.9 billion, a 46% increase.

Market share data reinforces the trend. Lilly now commands 60.9% of the U.S. incretin analog market, up from a smaller base a year prior. Internationally, the company holds 54.9% share, also expanding. Novo Nordisk’s share has been sliding in both markets as Lilly’s products continue winning new prescriptions.

Access is widening as well. The company’s Medicare GLP-1 Bridge program now covers an estimated 20 million potentially eligible patients, with beneficiaries paying just $50 per month out of pocket. Roughly 60% to 70% of program participants are new incretin starts, not existing patients switching therapies. That’s a meaningful signal that the total addressable market continues to grow rather than simply consolidating around existing players.

Foundayo, Lilly’s oral GLP-1, is still in its early innings but has already generated $98 million in its first reported quarter, with international launches underway in the UAE, Mexico, and Saudi Arabia.

A Deepening Pipeline Reduces Reliance on One Drug Class

Investors who worried about Lilly’s dependence on GLP-1 medications got a partial answer this quarter. Key product revenue in oncology, immunology, and neuroscience grew a combined 121% year-over-year. That’s a meaningful diversification signal, even if the dollar amounts remain small relative to the diabetes and obesity franchise.

Jaypirca, Lilly’s blood cancer therapy, posted a 56% sales increase and secured approval for line-agnostic use in chronic lymphocytic leukemia in the European Union. Ebglyss, an immunology asset, grew sales 131% year-over-year following approval for less-frequent maintenance dosing, a change that should improve patient adherence.

Retatrutide, viewed by many analysts as Lilly’s next major cardiometabolic asset, delivered strong data across its TRIUMPH trial program. Patients achieved weight loss of up to 28.3% at the highest dose tested in one obesity trial, with consistent results across trials targeting different comorbidities. Regulatory submissions for retatrutide are now expected in 2027.

Lilly also continued an aggressive acquisition strategy, announcing or completing four deals this quarter spanning oncology, neuroscience, immunology, and infectious disease.

Technical Picture Reflects the Fundamental Strength

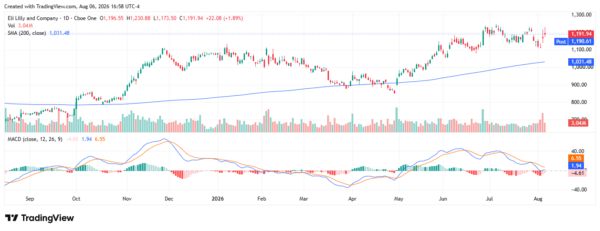
LLY’s chart tells a similar story to the earnings print. Shares have climbed from below $800 last September to nearly $1,200 currently, trading well above its 200-day simple moving average near $1,031. That’s a textbook sign of sustained institutional buying.

The MACD indicator shows a bullish crossover forming, with the MACD line moving above the signal line after a brief consolidation period through late July. Volume on the earnings reaction session came in elevated relative to recent averages.
lilly - StockEarnings

A Stock That’s Earned Its Premium, For Now

Lilly’s guidance update reinforces the bullish case. Full-year revenue guidance rose to a range of $85 billion to $87 billion, up from $82 billion to $85 billion previously. Management did flag potential deceleration in the coming quarters, tied to prior-period adjustments and seasonal patterns.

That caution matters less than it might sound. Any slowdown would come off a dramatically higher revenue base than a year ago. Analysts have continued raising price targets following the report. Whether Lilly proves to be a true “forever stock” remains an open question, but right now, the fundamentals are doing the talking.


A former marketing copywriter turned freelance financial writer and market analyst. I have a passion for delivering insights to investors. I write regularly about stocks for StockEarnings and MarketBeat. Posts are not advice.

Join over 1.2M+ investors/traders who receive daily and weekly notable earnings alerts with predicted move