Straight out of the gates, it must be acknowledged that ARM Holdings (NASDAQ: ARM) is a high-risk affair. Although I am bullish on ARM stock, the basis for this speculative proposition is based on a very limited sample size of data. Quite frankly, you should only engage this semiconductor and software design company with funds you can afford to lose.
But then, the cautionary stance raises an obvious question: why am I excited about ARM stock? It comes down to the quantitative profile of the tech ticker. Based on trends witnessed from similar circumstances, ARM may be due for a strong comeback over the next several weeks. However, the problem is that the inductive analysis undergirding my bull thesis is not extensively backed by empirical data — considering that shares started trading only since September 2023.
What does that mean for those willing to stick their necks out? Obviously, it’s much easier to have confidence in inductive analyses when a particular pattern has been observed frequently and consistently. In the case of ARM stock, we just don’t have enough trading history. Therefore, any statistical implications must be taken with a massive grain of salt.
Nevertheless, if the future resembles the past, ARM stock could see an impressive performance around the Sep. 18 expiration date. And since the smart money is rather pensive about the semiconductor company, going contrarian could lead to outsized rewards.
Disclosing the Two Presuppositions Behind ARM Stock
I’ll be working with two key presuppositions in my analysis of ARM stock. First, I assume that future market outcomes are dependent variables. This philosophy aligns with the concept of Markov chains, where the future state of a system depends on the current state. Second, I believe that order flow imbalances trigger certain responses from market players, thus enabling a possible blueprint for what may happen next.
These concepts might sound confusing at first glance but they’re intuitive and are readily deployed in the financial media ecosystem. For example, practically every finance writer believes that market returns are dependent variables. If you look at common themes, you’ll discover titles such as “3 Best Stocks to Buy Now” or “5 Reasons Why This Tech Stock is Undervalued.”
Such motifs are impossible to cohesively generate unless the person making the claim assumes that a future outcome depends on a specific condition or catalyst that they have identified. Otherwise, if a writer believed that the future market returns were independent variables, they would write articles entitled, “3 Stocks Taking a Random Walk.”
Since the equities system doesn’t operate in a risk-free environment, you have an entire industry dedicated to deciphering what the true fair value of a public security should be. As such, variable dependency is a cornerstone assumption in finance.
Regarding order flow imbalances, this is another point that financial writers accept, whether they consciously realize it or not. Look at ARM stock, which is down more than 22% in the trailing month. There are contrarians who instinctively believe that the ticker has been beaten down too much and that it’s “due” for a bounce higher.
You can call it mean reversion, buying on the dip or whatever other term — people sense that crimson-stained shares of good companies can rip higher. The difference between my work and everyone else is that I seek to quantify these transitions.
Playing the Order Flow Game
What has really intrigued me about ARM stock is the negative balance of the security’s current order flow. In the last 10 weeks, ARM has printed four up weeks, leading to a downward slope (due to the balance of negative sessions outnumbering positive sessions). This 4-6-D quantitative sequence has materialized 17 times on a rolling basis since the ticker’s public debut and has historically led to above-average performances.
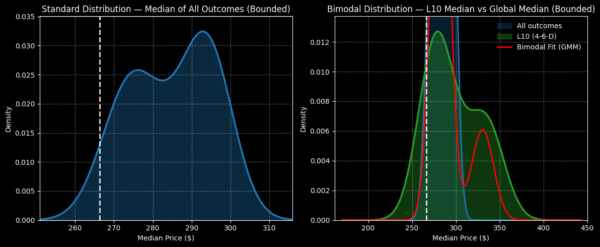
When the above signal flashes, traders can expect a forward 10-week distribution ranging between $200 and $400 (assuming a starting price of $266.33), with probability density peaking around $275. In contrast, a random 10-week hold would be expected to deliver a distribution ranging between $250 and $315, with peak probability density hitting around $292.
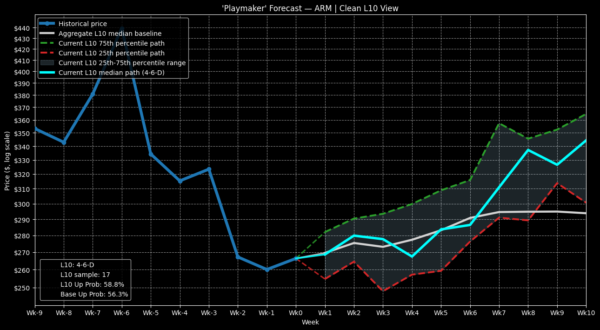
Granted, this is a strange dichotomy and part of it centers on the uneven nature of the signal’s expected performance versus the random baseline. Under 4-6-D conditions, ARM stock has tended to trade in almost lock-step with the random baseline over the next six weeks. But beginning in the seventh week onward, ARM’s median price tends to rise dramatically higher.
By week 8 following the flashing of the signal, the median endpoint of ARM stock is well over $330. What’s more, the 75th percentile pathway is around $347 while the 25th percentile pathway clocks in at $290 at the same time period.
However, this calculation doesn’t mean that you should rush out and buy Sep.18 call option spreads with a $330 strike. Well, you can if you so please, but the low sample size makes confidence in the trade a luxury that few can afford. That’s why I said it’s better to treat ARM stock as a gamble.
Another reason to be cautious is the volatility skew for the Sep. 18 options chain. To make a long story short, the volatility surface appears to show a prioritization toward downside protection, with implied volatility spiking for far out-the-money (OTM) puts, while IV is relatively muted for OTM calls. Basically, following ARM’s July 29 earnings disclosure, smart money sentiment appears protective.
Penciling a Highly Speculative Trade
Still, for those who are intrigued by the contrarian opportunity, the 300/310 bull call spread expiring Sep. 18 arguably seems the most reasonable when looking at the empirical data. Should ARM stock rise through the $310 strike at expiration, the maximum payout would clock in at over 132%. But the biggest highlight for me is the breakeven price of $304.30.
Right now, Wall Street assigns a probability of profit of only 35.8% that ARM stock will hit the threshold at expiration. However, this calculation comes from the Black-Scholes model, which assumes that market returns are independent variables. Stated differently, no matter what structurally occurs to ARM, the output is run through the parameters of the underlying formula, possibly creating an inaccurate picture.
Instead, as I mentioned earlier, I operate under the assumption that market returns are dependent variables. Essentially, this means that whatever has recently influenced ARM stock will likely play a role in how the market responds to the ticker.
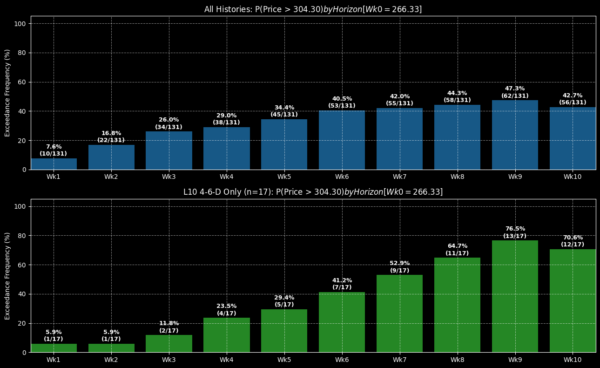
More to the point, of the 17 times that the 4-6-D signal has flashed, ARM stock has exceeded the equivalent of the breakeven price of $304.30 a total of 11 times on week 8 (Sep. 18). Again, while the sample size is extremely small, the observed probability of profit under my model is 64.7%.
It’s still a high-risk gamble, let’s not kid ourselves. But if variable dependency wins the day, there could be a mathematical incentive to buy ARM stock call options.

