ajax loader

Loading...


Ride-the-Wave Strategy – Best for Stock Traders

Ride-the-Wave targets multi-day price momentum following a company’s earnings announcement (EA). With this strategy:

  1. Buy a stock one day post-EA if a stock reacts positively post-earnings:
    1. Near the close of trading the EA-day for a pre-market-EA
    2. Near the close of the following day for a post-market-EA
  2. Sell-to-close after 7-10 days, or possibly earlier if a desired price target is reached

Similarly,

  1. short a stock one day post-EA if a stock reacts negatively post-earnings:
    1. near the close of trading the EA-day for a premarket-EA
    2. near the close of the following day for a post-market-EA
  2. then buy-to-close after 7-10 days, or possibly earlier if a desired price target is reached

Important: Ride-the-Wave is predicated on significant price momentum triggered by an EA. The 7-10 day scenario is the maximum trade hold-time. If you see post EA-momentum is halted or reversed by a significant opposite move, re-evaluate your presence in the trade.

This popular StockEarnings screen below will give you a list of stocks that historically exhibit significant price momentum following an EA for the next seven days:

  1. Stocks exhibiting positive post-EA price moves are buy-candidates
  2. Stocks exhibiting negative post-EA price moves are sell/short-candidates

The screen includes those stocks whose Earnings just came out in last two days.

Screen criteria:

  1. Earnings Date Start Date : Current Date + -1 Day
  2. Earnings Date End Date : Current Date + -2 Days
  3. Predicted Move (Next Day) Max : 7%
  4. Predicted Move (On 7th Day) Min : 7%

Strategy Guideline:

  1. Buy the stock if stock has reacted positively. Short the stock if stock has reacted negatively (see above).
  2. Close the position in 7-10 days, or possibly earlier based on price move.

Volatility Crush Strategy - Best for Options Traders

The Volatility Crush strategy is used with stocks that typically experience relatively low-to-moderate price moves (≤4%) following their Earnings Announcements (EA). The basic trade idea is to sell put or call options right before the EA, collecting a credit when options premium is very high due to elevated implied volatility (IV). You then close the position right after the EA by buying the option back much cheaper due to the significant drop in IV that occurs after the mystery of the EA disappears. In assessing this trade, you need to do your homework to ensure you collect sufficient premium to make the trade worthwhile.

This trade is practical due to the low-to-moderate price-move after the EA, which generally won’t significantly affect the options price, unlike an “action” stock, which experience great price moves post-EA. With these symbols, if you’re on the right side of the price move, that’s a great thing. But if you’re on the wrong side of the move, not so great. Consequently, by minimizing the effect of the post-EA price move, you have a much better chance to profit from the reduction in IV without it being ruined by a violent price move.

For this trade, open the position either (1) the night before the EA when the company announces earnings or (2) during the EA day when it announces post-market, generally capturing IV at or close to its peak.

For this trade, open the position either (1) the night before the EA when the company announces earnings or (2) during the EA day when it announces post-market, generally capturing IV at or close to its peak.

This popular stockearnings screen will give you a list of stocks which do not react more than 4% fpost-EA. It includes only those stocks whose earnings are releasing next day.

Screen criteria:

  1. Earnings Date Start Date : Current Date + 1
  2. Earnings Date End Date : Current Date + 1
  3. Predicted Move (Next Day) Max : 4%
  4. Options Type: Weekly

Strategy Guideline:

  1. Options Strategy: Sell Call and Put
  2. Options Strike Price: Current Stock Price – (% Predicated Move x 2)
  3. Expiration Date: It should generally be the closest expiry immediately after the EA.
  4. Buy Insurance: Buying back Call and Put at Strike price which 10% lower than Sell Strike Price is optional but recommended.

Watch Video for More Detail

Volatility Rush Strategy - Best for Options Traders

The Volatility Rush takes advantage of increasing options premiums into earnings announcements (EA) caused by an anticipated rise in Implied Volatility (IV). With this strategy, Buy a Call and Put at-the-money (a long straddle) 2-3 weeks before the EA when IV is lower. Sell the position either (1) the night before the EA when the company announces earnings pre-market, or (2) during the EA day when it announces post-market, generally capturing IV at or close to its peak.

This popular screen will give you a list of stocks whose Options premiums tend to rise into Earnings. It includes only those stocks whose Earnings are at least two weeks away from today.

Screen criteria:

  1. Earnings Date Start Date : Current Date + 15 Days
  2. Earnings Date End Date : Current Date + 30 Days
  3. Predicted Move (Next Day) Min : 5%
  4. Options Type: Weekly or Monthly if that lines up with the two to three-week lead-time for entering the trade

Strategy Guideline:

  1. Buy a Straddle at or close to the money two to three weeks pre-EA.
  2. Sell the position either the night before the EA when the company announces earnings pre-market, or during the EA day when it announces post-market.
  3. Expiration date should generally be the closest expiry immediately after the EA.
  4. Straddle price should not be more 60% of predicted move.

Predicted Move (Volatility)

Similar to Implied Volatility in Options. Expected volatility % based on our Proprietary Volatility Predication Model. We are expecting that stock price will likely to reach % in either direction by the end of next trading session after Earnings are released and not necessarily the closing volatility %.

Why is it important?

    This indicator helps

  1. Knowing expected volatility in stocks after Earnings helps to decide trading stocks before Earnings Announcement.
  2. Taking Advantage of volatility collapse following Earnings Results by using Advance Options strategies such as Spread and Straddles.

Since Last Earnings

Change in share price since last Earnings release.

Why is it Important?

When share has gained more than 10% since it's last Earning release, it tends to over react to minor bad news and give up some gains if not all. So, it contains more downside volatility than upside When share has dropped more than 10% since it's last Earning release, it tends to over react to minor good news and recover some drops if not all. So, it contains more upside volatility than downside.

EPS Surprise (%)

Occurs when a company's reported quarterly or annual profits are above or below analysts' expectations. Here is the formula to derive % EPS Surprice:

Actual EPS - Estimated EPS
------------------------------------- x 100
Estimated EPS

Why is it Important?

Earnings surprises can have a huge impact on a company's stock price. Several studies suggest that positive earnings surprises not only lead to an immediate hike in a stock's price, but also to a gradual increase over time. Hence, it's not surprising that some companies are known for routinely beating earning projections. A negative earnings surprise will usually result in a decline in share price.

Next Day Price Change (%)

Next Regular trading session Closing price following Earnings result.

For After Market Close Earnings, It is a next trading day closing price. For Before Market Open Earnings, It is the same trading day closing price.

Why is it Important?

Next Day price change is a reaction of Earnings result.

What Kind Of Customers Would Adobe’s AI Spending Create?

Posted on Sep 08, 2026 by Grayson Cavern

What Kind Of Customers Would Adobe’s AI Spending Create?

Adobe Inc (Nasdaq: ADBE) heads into its next earnings report with a user-growth strategy that could strengthen the business or pressure its economics. The company is pushing AI tools to a much broader audience while its professional software remains the foundation of the business.

Some investors would take that for a bull case. Not me. Because if there’s anything being in marketing and the stock market has taught me, it’s that acquiring new customers and acquiring new paying customers are two different things. The former can move up the funnel and become the latter, but I can’t assume that happens with every business. Especially not when Adobe has opened its products to a much wider audience and added as many as 190 million new monthly active users.

If millions of those users adopt Adobe’s AI tools without upgrading to higher-value subscriptions, Adobe could grow usage faster than revenue per user grows. That would put pressure on the growth profile investors expect from a company built around recurring revenue and cash generation.

So where do those users go from here? Q3 earnings should give us another look.

The User Count Is Only Half The Story


When I wrote about Adobe after Q2, I argued that the market had brushed aside the 190 million new monthly active users because investors wanted to know who those people were and whether Adobe could turn them into meaningful revenue, and that question has become even more important heading into Q3.

Adobe already has evidence that some of the monetization is happening. AI-first ARR passed $500 million in Q2 and more than tripled year over year, while total ARR reached $27.10 billion.

But the 190 million figure includes people coming through Firefly, Express and Acrobat, so I would not treat every new user as a future Creative Cloud subscriber. The bigger opportunity lies in whether Adobe can move people who entered through simpler AI-powered products deeper into the ecosystem.

That’s a much better anticipation than whether revenue beats by a few million dollars. How much of that enormous new audience is becoming a paying Adobe customer?

Adobe Has Given Itself Room To Find Out

Adobe deliberately pushed harder on freemium growth while deferring some planned optimizations to the Creative Cloud line, according to the framework from our last breakdown. That choice makes sense if the company believes user acquisition today creates more valuable subscriptions tomorrow.

The Q2 numbers already showed where the business stood before this quarter. Total subscription revenue reached $6.39 billion, up 14% year over year, while Business Professionals & Consumers subscription revenue grew 16% and Creative & Marketing Professionals grew 13%.

Q3 guidance calls for total revenue between $6.67 billion and $6.72 billion, with Creative & Marketing Professionals subscription revenue between $4.61 billion and $4.64 billion and Business Professionals & Consumers subscription revenue between $1.87 billion and $1.89 billion. Adobe also expects non-GAAP EPS between $6.05 and $6.10.

If Adobe reaches those numbers while AI-first ARR keeps climbing, the argument that AI is eating into the old business gets harder to defend. If the company delivers the guidance but AI monetization remains stuck at roughly the same level, investors have reason to keep treating the 190 million users as a vanity metric.

And there is another piece of this I don’t want to overlook.

The Moat Could Be Changing Without Disappearing

Adobe built its moat around professional workflows that took years to learn, and our last breakdown made that point clearly. Someone who spent a career mastering Photoshop, Illustrator, Premiere Pro or After Effects had plenty of reasons to remain inside Adobe’s ecosystem.

AI changes the entry point. A person no longer needs the same level of technical skill to produce something useful inside Adobe’s products. That can hurt Adobe if easier tools convince customers that they no longer need expensive professional software. It can also work in Adobe’s favor if those same users start with Firefly or Express and eventually need more sophisticated tools.

Folks, the mistake would be looking at AI adoption and automatically calling it positive. More usage only becomes valuable when Adobe captures the economics from that usage. So the Q3 report should give us a better read on which direction the company is moving.

A Technical Decision Point

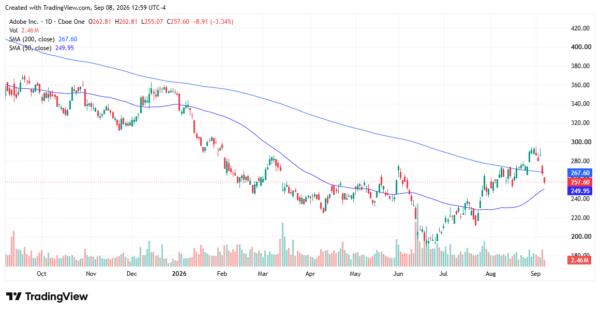
ADBE stock has spent the summer rebuilding after falling from the June area near $300 to roughly $190 in July, and the recovery carried ADBE back toward $300 before sellers pushed it down to $266.51 on Sept. 4.

ADBE now trades below its 20-day SMA at $274.12 and just under its 200-day SMA at $267.97, while the 50-day SMA sits at $248.85. That leaves the stock caught between the two averages that have shaped this recovery.

If buyers reclaim the 200-day and then push through the $274 area, the recovery starts to look like more than a bounce. The next real test sits around $280, where the stock has already struggled and where the rising trendline from July meets the recent price action.

But if earnings send ADBE back below the 200-day and toward the 50-day, traders have a different problem. The market would be telling us that good operating numbers still aren’t enough to restore confidence in the stock.

That is the setup I want going into earnings, because the report could decide whether this summer’s recovery becomes a new leg higher or another failed attempt to reclaim the old Adobe valuation.
adobe - StockEarnings

I’m Looking For The Users To Become Customers

Adobe doesn’t need every new user to become a high-paying Creative Cloud subscriber for this strategy to work, but it does need enough of that audience to move deeper into the paid ecosystem.

If the company can do that while keeping its professional base intact, the market may have underestimated what this AI transition can become.


Join over 1.2M+ investors/traders who receive daily and weekly notable earnings alerts with predicted move