AbbVie (NYSE: ABBV) just handed long-term investors another reason to stay patient. The company’s Q3 2026 earnings, released Oct. 30, beat expectations on revenue and earnings. Management raised full-year guidance again. The board also approved another dividend increase.
None of that is new for AbbVie. And that’s the point.
Many biopharma stocks trade on binary events. A trial reads out, and shares soar or sink. AbbVie has built something different: a diversified, cash-generating business that keeps compounding through patent cliffs that would sink weaker companies.
The Humira cliff was supposed to be a test. Humira once generated more than $20 billion a year. In the third quarter, it brought in just $683 million, down 31% from a year ago. Yet AbbVie’s total revenue still grew more than 10%.
ABBV stock traded near record highs heading into the report, up roughly 28% year-to-date. Some investors will see that as a reason to wait for a pullback. That may be true for traders. But for long-term investors, the Q3 earnings report reinforces why AbbVie continues to be one of the best buy-and-hold options in biopharma.
The case rests on four pillars. The immunology franchise is still accelerating. The chart looks constructive on any timeframe. The dividend keeps climbing. And free cash flow is funding what comes after its two biggest drugs, with room for more deals.
A Clean Beat Behind a Misleading Headline
AbbVie reported net revenue of $17.40 billion, up 10.3% year-over-year. That topped the consensus estimate of about $17.32 billion. Adjusted earnings per share (EPS) came in at $3.82, ahead of the $3.73 consensus and seven cents above the company’s own guidance midpoint.
Headlines noted that adjusted EPS more than doubled. That is technically true but misleading. The year-ago quarter absorbed a $1.50-per-share charge for acquired research and milestones. Investors who focus on that number miss the real story.
The real story is profitability. AbbVie’s adjusted operating margin reached 48.7%. Management lifted full-year adjusted EPS guidance to $13.95–$13.99, up from $13.76–$13.96. It also raised revenue guidance by $200 million, bringing this year’s total increase to $800 million.
Skyrizi and Rinvoq Keep Outrunning Expectations
Immunology remained the engine. The segment generated $9.17 billion, up 16.6% on an operational basis.
Skyrizi led the way with $5.78 billion in sales, up 22.9%. Rinvoq added $2.71 billion, up 24.3%. Together, the two drugs produced about 12 times Humira’s quarterly revenue. Management says Skyrizi now captures roughly one in two new or switching psoriasis patients.
AbbVie raised Skyrizi’s full-year sales forecast for the third time. It now expects $21.8 billion from Skyrizi and $10.3 billion from Rinvoq. Combined, the pair should add about $6 billion in growth this year, despite new competition.
The runway keeps getting longer. The FDA approved subcutaneous Skyrizi induction for Crohn’s disease. Rinvoq won European approval in vitiligo and alopecia areata, with U.S. filings under review.
Immunology isn’t carrying the load alone, either. Neuroscience revenue rose 19.5% to $3.39 billion, powered by Vraylar, Botox Therapeutic, Ubrelvy and Qulipta.
The Chart Looks Compelling on Any Timeframe
Fundamentals tell investors what to own. Charts help them judge how the market is treating it. With AbbVie, both point the same way.
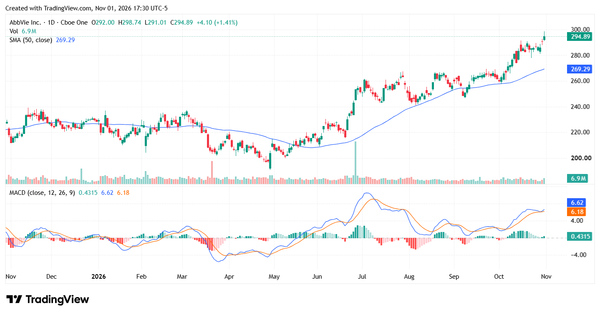
One-year chart: AbbVie spent last winter in a sideways range between roughly $210 and $240. A spring selloff pushed shares to about $192 in late April. Then the trend turned. The stock reclaimed its 50-day simple moving average (SMA) in late May and gapped higher on heavy volume in late June, when the Apogee deal was announced.
Since then, the chart has printed higher highs and higher lows. Pullbacks in August and September stopped near the rising 50-day SMA, now about $269. On earnings day, shares hit a record $298.74 intraday and closed at $294.89, up 1.4%. The MACD sits above its signal line and is curling higher. Momentum is rebuilding, not fading.
Five-year chart: The weekly chart tells a longer version of the same story. After rallying to about $175 in 2022, shares consolidated between roughly $135 and $170 through 2023. Those were the years Humira biosimilars hit the U.S. market. Investors who sold then acted on perception. The fundamentals were already shifting to Skyrizi and Rinvoq.
Since breaking out in early 2024, AbbVie has climbed a steady staircase above its rising 50-week SMA. Each major dip, in spring 2025 and again in spring 2026, found buyers near that average. The stock has more than doubled from its late-2021 level near $115. Weekly MACD now sits at its highest reading of the entire period.
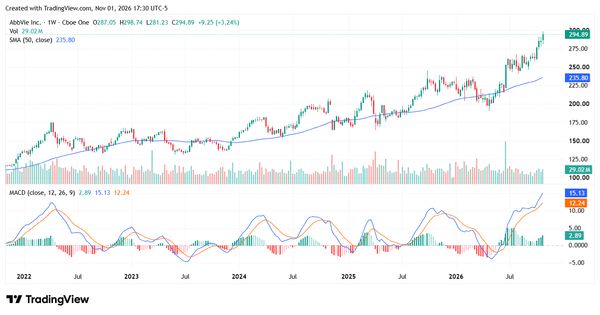
Whether an investor looks at 12 months or five years, the picture is the same: an uptrend that keeps getting bought. One honest caution applies. Shares sit about 9% above the 50-day SMA and roughly 25% above the 50-week SMA. That stretch could bring a pause in the coming weeks. For a buy-and-hold investor, a retest of the $270 area would be an opportunity, not a warning.
A Dividend That Keeps Climbing
Income investors got their annual raise. AbbVie lifted its quarterly dividend 5.2%, from $1.73 to $1.82 per share. The new rate begins with the Feb. 16, 2027 payment to shareholders of record on Jan. 15.
That works out to $7.28 per share annually. At the Oct. 30 close of $294.89, the forward yield is about 2.5%.
The longer record is more impressive. AbbVie has raised its quarterly dividend by 355% since its 2013 spinoff from Abbott Laboratories. It is a member of the S&P 500 Dividend Aristocrats, and it qualifies as a Dividend King when Abbott’s history is included.
Some screens flag a GAAP payout ratio near 200%. That is another case of perception versus fundamentals. GAAP earnings are weighed down by non-cash amortization and acquisition charges. Measured against the midpoint of adjusted EPS guidance, the new dividend represents a payout ratio of roughly 52%.
What Comes After Skyrizi and Rinvoq? Look at AbbVie’s Track Record
The strongest objection to AbbVie is concentration. Skyrizi and Rinvoq produced nearly half of third-quarter revenue. Investors who lived through the Humira cliff fairly ask what happens when these drugs face their own.
The best answer is AbbVie’s history. Skeptics asked the same question about Humira for a decade. AbbVie answered by building two successors that now outsell Humira’s peak. The company has shown it can see a cliff coming and pay to bridge it.
The $10.9 billion acquisition of Apogee Therapeutics, completed in the third quarter, is the next bridge. It is AbbVie’s largest deal since Allergan. The company paid $135.11 per share in cash.
Apogee’s lead asset is zumilokibart, a long-acting antibody targeting IL-13 for atopic dermatitis. In a Phase 2 study, all three dose regimens met their primary endpoint. Early data support maintenance dosing as infrequently as once or twice a year. That could be a meaningful convenience edge in a market now dominated by Dupixent.
Apogee also brings APG273, a combination targeting IL-13 and TSLP in asthma. AbbVie sees mega-blockbuster potential across the pipeline, meaning peak sales above $10 billion.
Investors should be clear-eyed about timing. AbbVie doesn’t expect the deal to add to adjusted EPS until 2032. This is a long-term bet — which is exactly why it suits long-term shareholders.
Apogee isn’t the only shot on goal. Lutikizumab posted positive Phase 3 results in hidradenitis suppurativa. The FDA approved Juvmo for Parkinson’s disease. AbbVie also filed for approval of etentamig in multiple myeloma and is advancing an obesity candidate, ABBV-295.
Free Cash Flow Funds the Next Deal — and the Dividend
Apogee is unlikely to be AbbVie’s last deal, and the cash flow statement explains why. AbbVie generated about $14 billion of free cash flow in the first nine months of 2026, according to CFO Scott Reents. The company also ended September with $10.8 billion in cash.
At that pace, annual free cash flow runs near $18 billion to $19 billion. The new dividend will cost roughly $12.9 billion a year. That leaves about $6 billion annually after paying shareholders, before any new borrowing.
Apogee cost $10.9 billion. In other words, AbbVie can fund an Apogee-sized deal roughly every two years from excess cash flow alone. Add modest borrowing, and the pace can be faster. The company has done exactly that, adding ImmunoGen and Cerevel in 2024 before Apogee this year.
There is a limit. Management is targeting net leverage of about two times within two to three years. That likely keeps future deals in the bolt-on range rather than another Allergan. For shareholders, that may be a feature. Disciplined, mid-sized deals for late-stage assets are how AbbVie built its bridge past Humira.
That brings the story back to the dividend. Each dollar of free cash flow does two jobs. It pays shareholders today and buys growth for tomorrow. Investors collect a roughly 2.5% yield, rising every year, while AbbVie builds its next Skyrizi. The dividend effectively pays investors to hold.
Why AbbVie Stock Is a Buy-and-Hold Biopharma Pick
AbbVie isn’t cheap after a strong run, and risks remain. Drug-pricing reform, rising competition in immunology, and acquisition-related debt all deserve attention.
But buy-and-hold investing isn’t about finding the perfect entry. It’s about owning businesses that keep getting stronger. AbbVie’s Q3 report shows a company growing double digits after losing its biggest drug, raising guidance, raising its dividend, and investing in its next growth chapter.
For investors seeking a biopharma stock to own for the next decade, AbbVie remains one of the best choices available.