ajax loader

Loading...


Ride-the-Wave Strategy – Best for Stock Traders

Ride-the-Wave targets multi-day price momentum following a company’s earnings announcement (EA). With this strategy:

  1. Buy a stock one day post-EA if a stock reacts positively post-earnings:
    1. Near the close of trading the EA-day for a pre-market-EA
    2. Near the close of the following day for a post-market-EA
  2. Sell-to-close after 7-10 days, or possibly earlier if a desired price target is reached

Similarly,

  1. short a stock one day post-EA if a stock reacts negatively post-earnings:
    1. near the close of trading the EA-day for a premarket-EA
    2. near the close of the following day for a post-market-EA
  2. then buy-to-close after 7-10 days, or possibly earlier if a desired price target is reached

Important: Ride-the-Wave is predicated on significant price momentum triggered by an EA. The 7-10 day scenario is the maximum trade hold-time. If you see post EA-momentum is halted or reversed by a significant opposite move, re-evaluate your presence in the trade.

This popular StockEarnings screen below will give you a list of stocks that historically exhibit significant price momentum following an EA for the next seven days:

  1. Stocks exhibiting positive post-EA price moves are buy-candidates
  2. Stocks exhibiting negative post-EA price moves are sell/short-candidates

The screen includes those stocks whose Earnings just came out in last two days.

Screen criteria:

  1. Earnings Date Start Date : Current Date + -1 Day
  2. Earnings Date End Date : Current Date + -2 Days
  3. Predicted Move (Next Day) Max : 7%
  4. Predicted Move (On 7th Day) Min : 7%

Strategy Guideline:

  1. Buy the stock if stock has reacted positively. Short the stock if stock has reacted negatively (see above).
  2. Close the position in 7-10 days, or possibly earlier based on price move.

Volatility Crush Strategy - Best for Options Traders

The Volatility Crush strategy is used with stocks that typically experience relatively low-to-moderate price moves (≤4%) following their Earnings Announcements (EA). The basic trade idea is to sell put or call options right before the EA, collecting a credit when options premium is very high due to elevated implied volatility (IV). You then close the position right after the EA by buying the option back much cheaper due to the significant drop in IV that occurs after the mystery of the EA disappears. In assessing this trade, you need to do your homework to ensure you collect sufficient premium to make the trade worthwhile.

This trade is practical due to the low-to-moderate price-move after the EA, which generally won’t significantly affect the options price, unlike an “action” stock, which experience great price moves post-EA. With these symbols, if you’re on the right side of the price move, that’s a great thing. But if you’re on the wrong side of the move, not so great. Consequently, by minimizing the effect of the post-EA price move, you have a much better chance to profit from the reduction in IV without it being ruined by a violent price move.

For this trade, open the position either (1) the night before the EA when the company announces earnings or (2) during the EA day when it announces post-market, generally capturing IV at or close to its peak.

For this trade, open the position either (1) the night before the EA when the company announces earnings or (2) during the EA day when it announces post-market, generally capturing IV at or close to its peak.

This popular stockearnings screen will give you a list of stocks which do not react more than 4% fpost-EA. It includes only those stocks whose earnings are releasing next day.

Screen criteria:

  1. Earnings Date Start Date : Current Date + 1
  2. Earnings Date End Date : Current Date + 1
  3. Predicted Move (Next Day) Max : 4%
  4. Options Type: Weekly

Strategy Guideline:

  1. Options Strategy: Sell Call and Put
  2. Options Strike Price: Current Stock Price – (% Predicated Move x 2)
  3. Expiration Date: It should generally be the closest expiry immediately after the EA.
  4. Buy Insurance: Buying back Call and Put at Strike price which 10% lower than Sell Strike Price is optional but recommended.

Watch Video for More Detail

Volatility Rush Strategy - Best for Options Traders

The Volatility Rush takes advantage of increasing options premiums into earnings announcements (EA) caused by an anticipated rise in Implied Volatility (IV). With this strategy, Buy a Call and Put at-the-money (a long straddle) 2-3 weeks before the EA when IV is lower. Sell the position either (1) the night before the EA when the company announces earnings pre-market, or (2) during the EA day when it announces post-market, generally capturing IV at or close to its peak.

This popular screen will give you a list of stocks whose Options premiums tend to rise into Earnings. It includes only those stocks whose Earnings are at least two weeks away from today.

Screen criteria:

  1. Earnings Date Start Date : Current Date + 15 Days
  2. Earnings Date End Date : Current Date + 30 Days
  3. Predicted Move (Next Day) Min : 5%
  4. Options Type: Weekly or Monthly if that lines up with the two to three-week lead-time for entering the trade

Strategy Guideline:

  1. Buy a Straddle at or close to the money two to three weeks pre-EA.
  2. Sell the position either the night before the EA when the company announces earnings pre-market, or during the EA day when it announces post-market.
  3. Expiration date should generally be the closest expiry immediately after the EA.
  4. Straddle price should not be more 60% of predicted move.

Predicted Move (Volatility)

Similar to Implied Volatility in Options. Expected volatility % based on our Proprietary Volatility Predication Model. We are expecting that stock price will likely to reach % in either direction by the end of next trading session after Earnings are released and not necessarily the closing volatility %.

Why is it important?

    This indicator helps

  1. Knowing expected volatility in stocks after Earnings helps to decide trading stocks before Earnings Announcement.
  2. Taking Advantage of volatility collapse following Earnings Results by using Advance Options strategies such as Spread and Straddles.

Since Last Earnings

Change in share price since last Earnings release.

Why is it Important?

When share has gained more than 10% since it's last Earning release, it tends to over react to minor bad news and give up some gains if not all. So, it contains more downside volatility than upside When share has dropped more than 10% since it's last Earning release, it tends to over react to minor good news and recover some drops if not all. So, it contains more upside volatility than downside.

EPS Surprise (%)

Occurs when a company's reported quarterly or annual profits are above or below analysts' expectations. Here is the formula to derive % EPS Surprice:

Actual EPS - Estimated EPS
------------------------------------- x 100
Estimated EPS

Why is it Important?

Earnings surprises can have a huge impact on a company's stock price. Several studies suggest that positive earnings surprises not only lead to an immediate hike in a stock's price, but also to a gradual increase over time. Hence, it's not surprising that some companies are known for routinely beating earning projections. A negative earnings surprise will usually result in a decline in share price.

Next Day Price Change (%)

Next Regular trading session Closing price following Earnings result.

For After Market Close Earnings, It is a next trading day closing price. For Before Market Open Earnings, It is the same trading day closing price.

Why is it Important?

Next Day price change is a reaction of Earnings result.

Walmart’s $187.9 Billion Quarter Was Just the Start of Its 5-Step Strategy

Posted on Aug 21, 2026 by Grayson Cavern

Walmart’s $187.9 Billion Quarter Was Just the Start of Its 5-Step Strategy

Walmart Inc (NYSE: WMT) gave the market enough ammo to shoot first and read later. WMT’s U.S. comparable sales grew 2.6% in the second quarter, missing expectations and coming in well below the 4.6% growth posted a year earlier.

Then you flip the page and see $187.9 billion in revenue, up 5.9%, $0.81 in adjusted EPS, and 23% global eCommerce growth.

Management also pointed to a 125-basis-point drag from health and wellness, while core merchandise remained closer to the 3%–4% growth range it says has held for the past two and a half years. 

But the more interesting discovery comes after you work through the quarter.

You see, the company is building a 5-step strategy designed to make customers spend more when they shop, return more often, move that activity into the company’s digital ecosystem, and become increasingly valuable every time they do.

The first step is already producing a number that should make investors sit up: customers using Sparky spend 40% more per order than non-users.

And Sparky is only the opening move.

Step One: Sparky AI


Walmart is not throwing an AI chatbot into the app just to join the AI parade. Sparky users rose 70% year over year, while users of the shopping assistant spend 40% more per order than non-users. 

The assistant helps shoppers build meals, create recipes, and load items directly into their baskets. If Sparky keeps making shopping easier, Walmart gets a cleaner shot at expanding the basket before checkout.

Step Two: Speed

Once the basket is built, the company wants customers to have it quickly enough to make fast delivery part of the shopping habit. Fast delivery grew 48% in the U.S., while WMT expanded sub-30-minute delivery to 38 markets. 

Customers using fast delivery shop more frequently and are more likely to become Walmart+ members. Sparky gets the order started; speed gives customers a reason to place another one.

Step Three: eCommerce

WMT’s digital growth is no longer just about chasing bigger sales numbers. Global eCommerce grew 23%, including 24% at Walmart U.S., while Marketplace sales rose more than 50%. 

More importantly, WMT’s U.S. eCommerce generated double-digit incremental margins during the first half. The growth is still ripping, and the economics are finally moving with it.

Step Four: The Traffic

More digital traffic gives the company something its old retail model could never fully monetize: the ability to sell brands access to customers already inside its ecosystem. Global advertising grew 38%, while Walmart Connect climbed 43%. 

The company gets customers in the door, gets more of their spending online, then charges brands to reach them.

Step Five: Walmart+

Membership completes the loop. Members spend roughly four times more than non-members, while membership fee revenue grew 17% globally and Walmart+ delivered its strongest first-half membership growth on record. 

Sparky lifts the order, fast delivery increases frequency, eCommerce captures the spending, advertising monetizes the traffic, and Walmart+ keeps the highest-value customers coming back.

The $2.9 Billion Refund Was Real

WMT received substantially all of the roughly $2.9 billion in tariff refunds it was eligible for, a windfall equal to about 0.5% of annual U.S. net sales, and management said the money created a net benefit of approximately 750 basis points to Q2 operating-income growth before the company began plowing much of it back into price investments. 

Target (NYSE: TGT) received $994 million, Amazon (NASDAQ: AMZN) roughly $640 million, while Nike (NYSE: NKE) and FedEx (NYSE: FDX) were among other Fortune 500 companies recovering significant amounts. 

The refund juiced the quarter. The interesting part is what Walmart did with it.

Instead of sitting on the windfall, the company pushed more of it into prices, increasing rollbacks from 7,200 in the first quarter to more than 11,000 in the second. I’m more interested in what WMT is doing with the money. It just got handed fresh ammunition and chose to fire it at price-sensitive consumers and weaker competitors.

The Chart Is Still Saying the Bulls Have Control

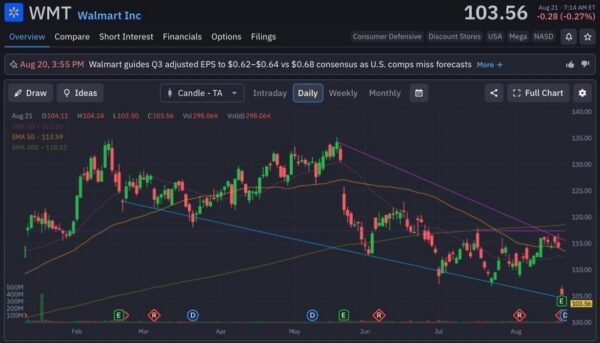
At $114.92, WMT sits above its 20-day SMA of $111.32, 50-day SMA of $106.48 and 200-day SMA of $94.67, keeping the broader trend pointed upward.

The $111.32 area is the first level to watch. Holding it keeps the pullback looking like a breather; losing it puts the $106.48 50-day average on the radar. For now, the chart still looks like what you want a strong mega-cap winner to look like – buyers are taking some chips off the table, but the bigger trend hasn’t broken.
Walmart-StockEarnings

I’m Buying the Weakness

I’m a BUY on Walmart. Wall Street saw a softer comparable-sales number and started looking for cracks. I see a company building a tighter ecosystem around the customer, then finding more ways to monetize every dollar flowing through it.

Just the kind of mega-cap setup I like. I don’t need WMT to become NVIDIA (NASDAQ: NVDA). All I need to see is Walmart making each customer more valuable than they were yesterday, and right now, the company is stocking multiple ways to do exactly that.

If the market wants to hand me that pullback while that machine is still gaining speed, I’m taking it.


Join over 1.2M+ investors/traders who receive daily and weekly notable earnings alerts with predicted move