ajax loader

Loading...


Ride-the-Wave Strategy – Best for Stock Traders

Ride-the-Wave targets multi-day price momentum following a company’s earnings announcement (EA). With this strategy:

  1. Buy a stock one day post-EA if a stock reacts positively post-earnings:
    1. Near the close of trading the EA-day for a pre-market-EA
    2. Near the close of the following day for a post-market-EA
  2. Sell-to-close after 7-10 days, or possibly earlier if a desired price target is reached

Similarly,

  1. short a stock one day post-EA if a stock reacts negatively post-earnings:
    1. near the close of trading the EA-day for a premarket-EA
    2. near the close of the following day for a post-market-EA
  2. then buy-to-close after 7-10 days, or possibly earlier if a desired price target is reached

Important: Ride-the-Wave is predicated on significant price momentum triggered by an EA. The 7-10 day scenario is the maximum trade hold-time. If you see post EA-momentum is halted or reversed by a significant opposite move, re-evaluate your presence in the trade.

This popular StockEarnings screen below will give you a list of stocks that historically exhibit significant price momentum following an EA for the next seven days:

  1. Stocks exhibiting positive post-EA price moves are buy-candidates
  2. Stocks exhibiting negative post-EA price moves are sell/short-candidates

The screen includes those stocks whose Earnings just came out in last two days.

Screen criteria:

  1. Earnings Date Start Date : Current Date + -1 Day
  2. Earnings Date End Date : Current Date + -2 Days
  3. Predicted Move (Next Day) Max : 7%
  4. Predicted Move (On 7th Day) Min : 7%

Strategy Guideline:

  1. Buy the stock if stock has reacted positively. Short the stock if stock has reacted negatively (see above).
  2. Close the position in 7-10 days, or possibly earlier based on price move.

Volatility Crush Strategy - Best for Options Traders

The Volatility Crush strategy is used with stocks that typically experience relatively low-to-moderate price moves (≤4%) following their Earnings Announcements (EA). The basic trade idea is to sell put or call options right before the EA, collecting a credit when options premium is very high due to elevated implied volatility (IV). You then close the position right after the EA by buying the option back much cheaper due to the significant drop in IV that occurs after the mystery of the EA disappears. In assessing this trade, you need to do your homework to ensure you collect sufficient premium to make the trade worthwhile.

This trade is practical due to the low-to-moderate price-move after the EA, which generally won’t significantly affect the options price, unlike an “action” stock, which experience great price moves post-EA. With these symbols, if you’re on the right side of the price move, that’s a great thing. But if you’re on the wrong side of the move, not so great. Consequently, by minimizing the effect of the post-EA price move, you have a much better chance to profit from the reduction in IV without it being ruined by a violent price move.

For this trade, open the position either (1) the night before the EA when the company announces earnings or (2) during the EA day when it announces post-market, generally capturing IV at or close to its peak.

For this trade, open the position either (1) the night before the EA when the company announces earnings or (2) during the EA day when it announces post-market, generally capturing IV at or close to its peak.

This popular stockearnings screen will give you a list of stocks which do not react more than 4% fpost-EA. It includes only those stocks whose earnings are releasing next day.

Screen criteria:

  1. Earnings Date Start Date : Current Date + 1
  2. Earnings Date End Date : Current Date + 1
  3. Predicted Move (Next Day) Max : 4%
  4. Options Type: Weekly

Strategy Guideline:

  1. Options Strategy: Sell Call and Put
  2. Options Strike Price: Current Stock Price – (% Predicated Move x 2)
  3. Expiration Date: It should generally be the closest expiry immediately after the EA.
  4. Buy Insurance: Buying back Call and Put at Strike price which 10% lower than Sell Strike Price is optional but recommended.

Watch Video for More Detail

Volatility Rush Strategy - Best for Options Traders

The Volatility Rush takes advantage of increasing options premiums into earnings announcements (EA) caused by an anticipated rise in Implied Volatility (IV). With this strategy, Buy a Call and Put at-the-money (a long straddle) 2-3 weeks before the EA when IV is lower. Sell the position either (1) the night before the EA when the company announces earnings pre-market, or (2) during the EA day when it announces post-market, generally capturing IV at or close to its peak.

This popular screen will give you a list of stocks whose Options premiums tend to rise into Earnings. It includes only those stocks whose Earnings are at least two weeks away from today.

Screen criteria:

  1. Earnings Date Start Date : Current Date + 15 Days
  2. Earnings Date End Date : Current Date + 30 Days
  3. Predicted Move (Next Day) Min : 5%
  4. Options Type: Weekly or Monthly if that lines up with the two to three-week lead-time for entering the trade

Strategy Guideline:

  1. Buy a Straddle at or close to the money two to three weeks pre-EA.
  2. Sell the position either the night before the EA when the company announces earnings pre-market, or during the EA day when it announces post-market.
  3. Expiration date should generally be the closest expiry immediately after the EA.
  4. Straddle price should not be more 60% of predicted move.

Predicted Move (Volatility)

Similar to Implied Volatility in Options. Expected volatility % based on our Proprietary Volatility Predication Model. We are expecting that stock price will likely to reach % in either direction by the end of next trading session after Earnings are released and not necessarily the closing volatility %.

Why is it important?

    This indicator helps

  1. Knowing expected volatility in stocks after Earnings helps to decide trading stocks before Earnings Announcement.
  2. Taking Advantage of volatility collapse following Earnings Results by using Advance Options strategies such as Spread and Straddles.

Since Last Earnings

Change in share price since last Earnings release.

Why is it Important?

When share has gained more than 10% since it's last Earning release, it tends to over react to minor bad news and give up some gains if not all. So, it contains more downside volatility than upside When share has dropped more than 10% since it's last Earning release, it tends to over react to minor good news and recover some drops if not all. So, it contains more upside volatility than downside.

EPS Surprise (%)

Occurs when a company's reported quarterly or annual profits are above or below analysts' expectations. Here is the formula to derive % EPS Surprice:

Actual EPS - Estimated EPS
------------------------------------- x 100
Estimated EPS

Why is it Important?

Earnings surprises can have a huge impact on a company's stock price. Several studies suggest that positive earnings surprises not only lead to an immediate hike in a stock's price, but also to a gradual increase over time. Hence, it's not surprising that some companies are known for routinely beating earning projections. A negative earnings surprise will usually result in a decline in share price.

Next Day Price Change (%)

Next Regular trading session Closing price following Earnings result.

For After Market Close Earnings, It is a next trading day closing price. For Before Market Open Earnings, It is the same trading day closing price.

Why is it Important?

Next Day price change is a reaction of Earnings result.

Target’s Turnaround Is Finally Being Measured in Footsteps

Posted on Aug 20, 2026 by Grayson Cavern

Target’s Turnaround Is Finally Being Measured in Footsteps

After spending much of 2025 trying to convince investors that its problems were fixable, Target Corp (NYSE: TGT) has finally produced the kind of quarter that makes you wonder whether the company has moved beyond promises and into the early stages of an actual recovery.

TGT generated $26.54 billion in second-quarter sales, beating the $26.13 billion consensus estimate, while reported EPS of $4.11 crushed expectations of about $2.33. The earnings number came with a major tariff-refund benefit, which we will get to later, but the sales beat was harder to dismiss.

What kept me reading, though, was the reason sales improved in the first place. Comparable sales rose 3.8%, and 3.6% of that growth came from more people walking into Target and shopping there. After a period in which retailers have fought harder for the same stretched consumer, the company is starting to bring shoppers back through the door. 

Which is great, especially when we have already seen how different the consumer story can look across retailers, from Home Depot Inc (NYSE: HD) trying to grow through a housing market that has yet to fully recover to Walmart Inc (NYSE: WMT) benefiting from a very different kind of consumer resilience.

Now Target has its own problem to solve too. For years, it was easier to blame inflation, tariffs, consumer pressure, inventory mistakes, or weak discretionary spending for the company’s struggles. 

Except these earnings now show shoppers coming back despite all of that. Which means the next big challenge now is whether TGT has given them enough reasons to stay.

The Shoppers Are Coming Back


That 3.6% jump in traffic becomes far more interesting when you follow it through the rest of TGT’s business, because the recovery was not confined to one product category, one shopping channel, or one type of customer.

All six of Target’s core merchandising categories grew from a year earlier. Fun 101 delivered double-digit growth, while Food & Beverage and Beauty each posted high-single-digit gains. Store comparable sales rose 2.7%, digital comparable sales climbed 8.7%, and same-day delivery grew more than 25%. Even TGT’s non-merchandise businesses, including Roundel advertising, Target Circle 360 and the Target+ marketplace, grew more than 20%. 

This means Target is not getting dragged forward by one lucky category or a single promotion that temporarily inflated the numbers. The company appears to be regaining relevance across the way people shop today, whether they walk into one of its stores, order online, or use Target’s increasingly valuable services around the core retail business.

That broader participation also gives more weight to the strategy management has spent the last year executing. Target cut prices on more than 10,000 frequently purchased items, while simultaneously pushing harder into new merchandise, style, convenience and store investment. Those moves are beginning to show up in the shopper’s behaviour. 

Even better, Target did not only get shoppers to spend more money each time they visited. Comparable traffic rose 3.6%, while the average transaction amount increased just 0.2%… making this quarter look less like inflation pushing the topline higher and more like a retailer rebuilding the habit of shopping at Target.

And once that habit returns, the economics of the turnaround become much more important.

Target Got $1 Billion Back But The Quarter Still Worked Without It

Target’s $4.11 EPS headline comes with an important asterisk: the company received $994 million in tariff refunds, a windfall that added $1.65 per share to the quarter. 

The refund was part of a much broader return of money to corporate America, with Fortune reporting that Amazon (NASDAQ: AMZN) received $600 million, while other Fortune 500 companies, including Nike (NYSE: NKE), FedEx (NYSE: FDX) and General Motors (NYSE: GM), have also recovered substantial tariff payments. 

Removing nearly $1 billion from Target’s reported profit tells a more useful story. The underlying business still delivered 3.8% comparable-sales growth, 3.6% traffic growth, and gross-margin expansion of roughly 100 basis points even without the refund. 

Management also raised its full-year sales outlook to around 5% growth, while the midpoint of its full-year EPS guidance, excluding the tariff benefit, increased by 75 cents from the previous outlook. 

Yeah, the $994 million refund made the EPS number look extraordinary, but Target was already showing signs of recovery before the money came back. 

Target’s Stock Is Finally Moving Like the Turnaround Is Real

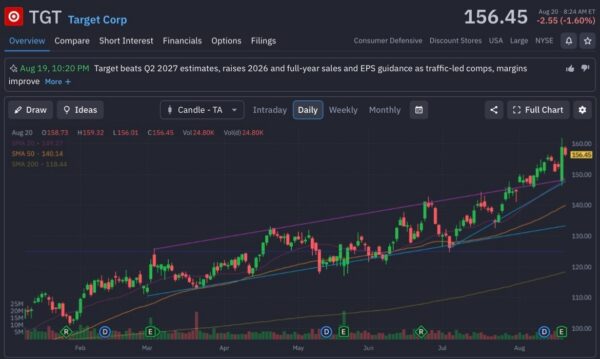
Target’s recovery is beginning to show up in the stock as well. At $156.45, TGT is trading above its 20-day SMA of $149.27, 50-day SMA of $140.14 and 200-day SMA of $118.44, with the widening gap between those averages reflecting how far the shares have climbed from their earlier lows.

The stock recently pushed above $160 before pulling back after earnings, but the broader uptrend remains intact. $149.27, where the 20-day moving average now sits, is the first level worth watching, while a break below it would bring the $140.14 50-day average back into play.

Adding to my positions on Target Corp isn’t irrational since the recovery is finally showing up where it matters. More shoppers are coming back, digital sales are accelerating, growth is broadening across the business, and the underlying earnings outlook improved even after removing the tariff-refund benefit.

For a stock that spent years getting punished because the business was losing momentum, TGT is becoming harder to ignore now that both the customers and the chart are moving in the right direction.
target-StockEarnings

Join over 1.2M+ investors/traders who receive daily and weekly notable earnings alerts with predicted move
