ajax loader

Loading...


Ride-the-Wave Strategy – Best for Stock Traders

Ride-the-Wave targets multi-day price momentum following a company’s earnings announcement (EA). With this strategy:

  1. Buy a stock one day post-EA if a stock reacts positively post-earnings:
    1. Near the close of trading the EA-day for a pre-market-EA
    2. Near the close of the following day for a post-market-EA
  2. Sell-to-close after 7-10 days, or possibly earlier if a desired price target is reached

Similarly,

  1. short a stock one day post-EA if a stock reacts negatively post-earnings:
    1. near the close of trading the EA-day for a premarket-EA
    2. near the close of the following day for a post-market-EA
  2. then buy-to-close after 7-10 days, or possibly earlier if a desired price target is reached

Important: Ride-the-Wave is predicated on significant price momentum triggered by an EA. The 7-10 day scenario is the maximum trade hold-time. If you see post EA-momentum is halted or reversed by a significant opposite move, re-evaluate your presence in the trade.

This popular StockEarnings screen below will give you a list of stocks that historically exhibit significant price momentum following an EA for the next seven days:

  1. Stocks exhibiting positive post-EA price moves are buy-candidates
  2. Stocks exhibiting negative post-EA price moves are sell/short-candidates

The screen includes those stocks whose Earnings just came out in last two days.

Screen criteria:

  1. Earnings Date Start Date : Current Date + -1 Day
  2. Earnings Date End Date : Current Date + -2 Days
  3. Predicted Move (Next Day) Max : 7%
  4. Predicted Move (On 7th Day) Min : 7%

Strategy Guideline:

  1. Buy the stock if stock has reacted positively. Short the stock if stock has reacted negatively (see above).
  2. Close the position in 7-10 days, or possibly earlier based on price move.

Volatility Crush Strategy - Best for Options Traders

The Volatility Crush strategy is used with stocks that typically experience relatively low-to-moderate price moves (≤4%) following their Earnings Announcements (EA). The basic trade idea is to sell put or call options right before the EA, collecting a credit when options premium is very high due to elevated implied volatility (IV). You then close the position right after the EA by buying the option back much cheaper due to the significant drop in IV that occurs after the mystery of the EA disappears. In assessing this trade, you need to do your homework to ensure you collect sufficient premium to make the trade worthwhile.

This trade is practical due to the low-to-moderate price-move after the EA, which generally won’t significantly affect the options price, unlike an “action” stock, which experience great price moves post-EA. With these symbols, if you’re on the right side of the price move, that’s a great thing. But if you’re on the wrong side of the move, not so great. Consequently, by minimizing the effect of the post-EA price move, you have a much better chance to profit from the reduction in IV without it being ruined by a violent price move.

For this trade, open the position either (1) the night before the EA when the company announces earnings or (2) during the EA day when it announces post-market, generally capturing IV at or close to its peak.

For this trade, open the position either (1) the night before the EA when the company announces earnings or (2) during the EA day when it announces post-market, generally capturing IV at or close to its peak.

This popular stockearnings screen will give you a list of stocks which do not react more than 4% fpost-EA. It includes only those stocks whose earnings are releasing next day.

Screen criteria:

  1. Earnings Date Start Date : Current Date + 1
  2. Earnings Date End Date : Current Date + 1
  3. Predicted Move (Next Day) Max : 4%
  4. Options Type: Weekly

Strategy Guideline:

  1. Options Strategy: Sell Call and Put
  2. Options Strike Price: Current Stock Price – (% Predicated Move x 2)
  3. Expiration Date: It should generally be the closest expiry immediately after the EA.
  4. Buy Insurance: Buying back Call and Put at Strike price which 10% lower than Sell Strike Price is optional but recommended.

Watch Video for More Detail

Volatility Rush Strategy - Best for Options Traders

The Volatility Rush takes advantage of increasing options premiums into earnings announcements (EA) caused by an anticipated rise in Implied Volatility (IV). With this strategy, Buy a Call and Put at-the-money (a long straddle) 2-3 weeks before the EA when IV is lower. Sell the position either (1) the night before the EA when the company announces earnings pre-market, or (2) during the EA day when it announces post-market, generally capturing IV at or close to its peak.

This popular screen will give you a list of stocks whose Options premiums tend to rise into Earnings. It includes only those stocks whose Earnings are at least two weeks away from today.

Screen criteria:

  1. Earnings Date Start Date : Current Date + 15 Days
  2. Earnings Date End Date : Current Date + 30 Days
  3. Predicted Move (Next Day) Min : 5%
  4. Options Type: Weekly or Monthly if that lines up with the two to three-week lead-time for entering the trade

Strategy Guideline:

  1. Buy a Straddle at or close to the money two to three weeks pre-EA.
  2. Sell the position either the night before the EA when the company announces earnings pre-market, or during the EA day when it announces post-market.
  3. Expiration date should generally be the closest expiry immediately after the EA.
  4. Straddle price should not be more 60% of predicted move.

Predicted Move (Volatility)

Similar to Implied Volatility in Options. Expected volatility % based on our Proprietary Volatility Predication Model. We are expecting that stock price will likely to reach % in either direction by the end of next trading session after Earnings are released and not necessarily the closing volatility %.

Why is it important?

    This indicator helps

  1. Knowing expected volatility in stocks after Earnings helps to decide trading stocks before Earnings Announcement.
  2. Taking Advantage of volatility collapse following Earnings Results by using Advance Options strategies such as Spread and Straddles.

Since Last Earnings

Change in share price since last Earnings release.

Why is it Important?

When share has gained more than 10% since it's last Earning release, it tends to over react to minor bad news and give up some gains if not all. So, it contains more downside volatility than upside When share has dropped more than 10% since it's last Earning release, it tends to over react to minor good news and recover some drops if not all. So, it contains more upside volatility than downside.

EPS Surprise (%)

Occurs when a company's reported quarterly or annual profits are above or below analysts' expectations. Here is the formula to derive % EPS Surprice:

Actual EPS - Estimated EPS
------------------------------------- x 100
Estimated EPS

Why is it Important?

Earnings surprises can have a huge impact on a company's stock price. Several studies suggest that positive earnings surprises not only lead to an immediate hike in a stock's price, but also to a gradual increase over time. Hence, it's not surprising that some companies are known for routinely beating earning projections. A negative earnings surprise will usually result in a decline in share price.

Next Day Price Change (%)

Next Regular trading session Closing price following Earnings result.

For After Market Close Earnings, It is a next trading day closing price. For Before Market Open Earnings, It is the same trading day closing price.

Why is it Important?

Next Day price change is a reaction of Earnings result.

ADI Just Crossed $4 Billion In Revenue But The Stock Is Sitting Below $400

Posted on Aug 20, 2026 by Grayson Cavern

ADI Just Crossed $4 Billion In Revenue But The Stock Is Sitting Below $400

For the first time in its history, Analog Devices (NASDAQ: ADI) crossed $4 billion in quarter 3 revenue, a milestone the company reached as its data-center business accelerated, its industrial markets recovered, and Wall Street watched for signs that the semiconductor cycle was finally turning in its favor.

Revenue came in at $4.02 billion, while adjusted EPS reached a record $3.45, beating expectations on both counts. But what makes this difficult to dismiss as a one-off is where management says the business goes next: its midpoint forecast calls for $4.3 billion in revenue and $3.86 in adjusted EPS, putting another record quarter directly in front of it.

Yet with all of that happening, ADI shares are sitting around $377, well below the roughly $440 they reached earlier this year.

That price action becomes more revealing when you look at what is producing the growth. Data-center demand is accelerating, industrial demand is recovering, and management says parts of the broader portfolio are still shipping below historical consumption levels, leaving the company to post record numbers before the recovery has fully worked its way through the business.

The $4 billion milestone tells you what ADI has already done. Now let’s find out how much recovery is left.

ADI’s AI Opportunity Starts Long Before the Chip


The recovery becomes far more revealing once you follow the demand beyond ADI’s income statement, because AI is creating pressure at nearly every point between the power grid and the processors doing the computing, and the company believes it has a product sitting somewhere along much of that chain.

Chairman and CEO Vincent Roche calls the strategy “grid to chip,”  covering everything from grid monitoring, energy storage and high-voltage power conversion to rack-level delivery, optical systems and processor-level power. 

The same AI buildout that has made NVIDIA (NASDAQ: NVDA) the face of the boom is creating problems far beyond the GPUs themselves: more electricity has to be generated and moved with less waste, while data has to travel between increasingly powerful processors at speeds traditional infrastructure was never designed to handle.

Though ADI isn’t alone in chasing those bottlenecks. Monolithic Power Systems (NASDAQ: MPWR), Infineon Technologies (OTC: IFNNY) and Texas Instruments (NASDAQ: TXN) operate across power and analog infrastructure, while Marvell Technology (NASDAQ: MRVL) and Coherent (NYSE: COHR) have their own positions in high-speed connectivity and optics…Its advantage is that it is trying to sit across several of those pressure points at once.

Management’s view of the prize has expanded accordingly, with its estimate of the 2030 data-center and energy opportunity more than doubling from what it envisioned a year ago. Bottomline is, the“Grid to chip” strategy is a good indicator of how much further into the AI buildout it wants to go.

AI Is Creating Problems ADI Has Spent Decades Solving

A data center drawing enormous amounts of power cannot simply add more racks and carry on. The electricity has to be generated, monitored and stored before moving through increasingly dense power architectures, while the heat, voltage loss and data traffic created by that compute keep forcing engineers to redesign what sits around the processors.

ADI has spent decades building products for exactly those kinds of problems.

Its energy business has already grown beyond $500 million, while management expects Optical Circuit Switching revenue to approximately double this year and deliver similar growth again in 2027. At the other end of the chain, its Empower acquisition is taking ADI closer to the processor through higher-voltage, processor-level power delivery.

That is why AI’s physical infrastructure matters so much to this story. Every new bottleneck creates another layer of spending, and ADI already operates across several of the areas now being pushed to their limits. The problem is that investors have already noticed.

The Recovery Has Brought ADI to Its First Real Test

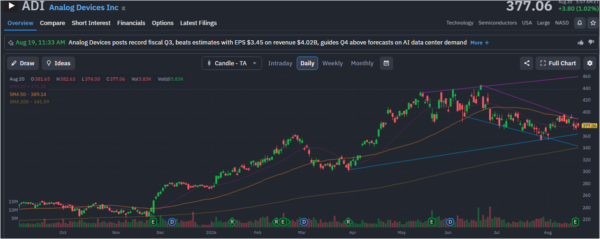
ADI’s chart is no longer describing a stock in free fall, and at $377.01, the shares now sit above the 200-day moving average of $341.09 while trading almost exactly at the 20-day average of $376.28. But with the 50-day moving average sitting higher at $389.14, the stock has reached a level where the recovery needs to prove it can keep advancing.

That proof has yet to show up in the volume. ADI traded 6.49 million shares in the latest session, and the stock remains below its 50-day average without the kind of participation that would suggest buyers are forcing a decisive break higher.

This is where the valuation debate becomes harder to ignore, because the business is recovering and the market has already rewarded that recovery, yet the technical picture still lacks the confirmation needed to dismiss concerns that investors may be paying too much for the improvement ahead.

The recovery may be real, but with the stock still trapped beneath its 50-day average and volume offering no clear breakout signal, the question is whether the next move higher has already been priced in.
ADI-StockEarnings

ADI Is Building A Bigger Story Than Its Stock May Have Priced In

It’s a strong buy on Analog Devices because the company does not need to win the GPU race to benefit from the AI boom. Its opportunity begins with the infrastructure required to support that compute, and AI is creating more demand for exactly the kind of power, data-conversion, connectivity and control systems ADI has spent decades building. And thanks to the “grid-to-chip” strategy, the company now has multiple ways to capture more of the AI infrastructure buildout as those systems become bigger and harder to power. 

Join over 1.2M+ investors/traders who receive daily and weekly notable earnings alerts with predicted move
