ajax loader

Loading...


Ride-the-Wave Strategy – Best for Stock Traders

Ride-the-Wave targets multi-day price momentum following a company’s earnings announcement (EA). With this strategy:

  1. Buy a stock one day post-EA if a stock reacts positively post-earnings:
    1. Near the close of trading the EA-day for a pre-market-EA
    2. Near the close of the following day for a post-market-EA
  2. Sell-to-close after 7-10 days, or possibly earlier if a desired price target is reached

Similarly,

  1. short a stock one day post-EA if a stock reacts negatively post-earnings:
    1. near the close of trading the EA-day for a premarket-EA
    2. near the close of the following day for a post-market-EA
  2. then buy-to-close after 7-10 days, or possibly earlier if a desired price target is reached

Important: Ride-the-Wave is predicated on significant price momentum triggered by an EA. The 7-10 day scenario is the maximum trade hold-time. If you see post EA-momentum is halted or reversed by a significant opposite move, re-evaluate your presence in the trade.

This popular StockEarnings screen below will give you a list of stocks that historically exhibit significant price momentum following an EA for the next seven days:

  1. Stocks exhibiting positive post-EA price moves are buy-candidates
  2. Stocks exhibiting negative post-EA price moves are sell/short-candidates

The screen includes those stocks whose Earnings just came out in last two days.

Screen criteria:

  1. Earnings Date Start Date : Current Date + -1 Day
  2. Earnings Date End Date : Current Date + -2 Days
  3. Predicted Move (Next Day) Max : 7%
  4. Predicted Move (On 7th Day) Min : 7%

Strategy Guideline:

  1. Buy the stock if stock has reacted positively. Short the stock if stock has reacted negatively (see above).
  2. Close the position in 7-10 days, or possibly earlier based on price move.

Volatility Crush Strategy - Best for Options Traders

The Volatility Crush strategy is used with stocks that typically experience relatively low-to-moderate price moves (≤4%) following their Earnings Announcements (EA). The basic trade idea is to sell put or call options right before the EA, collecting a credit when options premium is very high due to elevated implied volatility (IV). You then close the position right after the EA by buying the option back much cheaper due to the significant drop in IV that occurs after the mystery of the EA disappears. In assessing this trade, you need to do your homework to ensure you collect sufficient premium to make the trade worthwhile.

This trade is practical due to the low-to-moderate price-move after the EA, which generally won’t significantly affect the options price, unlike an “action” stock, which experience great price moves post-EA. With these symbols, if you’re on the right side of the price move, that’s a great thing. But if you’re on the wrong side of the move, not so great. Consequently, by minimizing the effect of the post-EA price move, you have a much better chance to profit from the reduction in IV without it being ruined by a violent price move.

For this trade, open the position either (1) the night before the EA when the company announces earnings or (2) during the EA day when it announces post-market, generally capturing IV at or close to its peak.

For this trade, open the position either (1) the night before the EA when the company announces earnings or (2) during the EA day when it announces post-market, generally capturing IV at or close to its peak.

This popular stockearnings screen will give you a list of stocks which do not react more than 4% fpost-EA. It includes only those stocks whose earnings are releasing next day.

Screen criteria:

  1. Earnings Date Start Date : Current Date + 1
  2. Earnings Date End Date : Current Date + 1
  3. Predicted Move (Next Day) Max : 4%
  4. Options Type: Weekly

Strategy Guideline:

  1. Options Strategy: Sell Call and Put
  2. Options Strike Price: Current Stock Price – (% Predicated Move x 2)
  3. Expiration Date: It should generally be the closest expiry immediately after the EA.
  4. Buy Insurance: Buying back Call and Put at Strike price which 10% lower than Sell Strike Price is optional but recommended.

Watch Video for More Detail

Volatility Rush Strategy - Best for Options Traders

The Volatility Rush takes advantage of increasing options premiums into earnings announcements (EA) caused by an anticipated rise in Implied Volatility (IV). With this strategy, Buy a Call and Put at-the-money (a long straddle) 2-3 weeks before the EA when IV is lower. Sell the position either (1) the night before the EA when the company announces earnings pre-market, or (2) during the EA day when it announces post-market, generally capturing IV at or close to its peak.

This popular screen will give you a list of stocks whose Options premiums tend to rise into Earnings. It includes only those stocks whose Earnings are at least two weeks away from today.

Screen criteria:

  1. Earnings Date Start Date : Current Date + 15 Days
  2. Earnings Date End Date : Current Date + 30 Days
  3. Predicted Move (Next Day) Min : 5%
  4. Options Type: Weekly or Monthly if that lines up with the two to three-week lead-time for entering the trade

Strategy Guideline:

  1. Buy a Straddle at or close to the money two to three weeks pre-EA.
  2. Sell the position either the night before the EA when the company announces earnings pre-market, or during the EA day when it announces post-market.
  3. Expiration date should generally be the closest expiry immediately after the EA.
  4. Straddle price should not be more 60% of predicted move.

Predicted Move (Volatility)

Similar to Implied Volatility in Options. Expected volatility % based on our Proprietary Volatility Predication Model. We are expecting that stock price will likely to reach % in either direction by the end of next trading session after Earnings are released and not necessarily the closing volatility %.

Why is it important?

    This indicator helps

  1. Knowing expected volatility in stocks after Earnings helps to decide trading stocks before Earnings Announcement.
  2. Taking Advantage of volatility collapse following Earnings Results by using Advance Options strategies such as Spread and Straddles.

Since Last Earnings

Change in share price since last Earnings release.

Why is it Important?

When share has gained more than 10% since it's last Earning release, it tends to over react to minor bad news and give up some gains if not all. So, it contains more downside volatility than upside When share has dropped more than 10% since it's last Earning release, it tends to over react to minor good news and recover some drops if not all. So, it contains more upside volatility than downside.

EPS Surprise (%)

Occurs when a company's reported quarterly or annual profits are above or below analysts' expectations. Here is the formula to derive % EPS Surprice:

Actual EPS - Estimated EPS
------------------------------------- x 100
Estimated EPS

Why is it Important?

Earnings surprises can have a huge impact on a company's stock price. Several studies suggest that positive earnings surprises not only lead to an immediate hike in a stock's price, but also to a gradual increase over time. Hence, it's not surprising that some companies are known for routinely beating earning projections. A negative earnings surprise will usually result in a decline in share price.

Next Day Price Change (%)

Next Regular trading session Closing price following Earnings result.

For After Market Close Earnings, It is a next trading day closing price. For Before Market Open Earnings, It is the same trading day closing price.

Why is it Important?

Next Day price change is a reaction of Earnings result.

Investigating Home Depot’s Best Quarter Since 2022 Amidst Housing Crisis

Posted on Aug 19, 2026 by Grayson Cavern

Investigating Home Depot’s Best Quarter Since 2022 Amidst Housing Crisis

Home Depot (NYSE: HD) just beat Wall Street on both earnings and revenue, delivering $4.92 in adjusted EPS and $47.9 billion in sales, while comparable sales rose 1.7% in Q2 2026 earnings –  the company’s strongest growth since Q3 2022. Yet Chairman and CEO Ted Decker came off the same earnings call saying Home Depot still had not seen an inflection point in housing. 

The numbers outside Home Depot have hardly offered a clean recovery story either, with Bloomberg reporting pending home sales sliding to their weakest level while CBS News continues to point to a housing shortage that has helped keep rental costs elevated.

So if housing turnover remains depressed and Home Depot itself still sees no inflection point…

How did the company just produce its best comparable-sales growth in nearly three years?

Let’s Look Past the Headline


Home Depot had 13 of its 16 merchandising departments post positive comparable sales in the quarter. That immediately complicates the idea that one category, one project type, or one temporary spending pocket dragged the company through.

Transactions above $1,000 increased 2.4%. Pro customer sales outperformed DIY. Online sales rose 11%. Those aren’t the figures of a broad housing recovery suddenly washing over the business. Home Depot’s management had already ruled that out.

And yet, the improvement was spread across enough of the company to produce its strongest comparable-sales growth in nearly three years.

Now, if housing hasn’t yet provided the recovery, and Home Depot’s growth is showing up across categories anyway, the next question isn’t whether the business is growing. It’s whose business that growth is coming from.

Management gave a fairly direct answer on the call: market share gains.

Home Depot Bought A Second Front Door Into The Pro Market

Management attributed part of the quarter’s growth to market-share gains. That becomes more interesting when you look at what Home Depot has spent the past few years building around the professional customer.

The biggest move was the $18.25 billion acquisition of SRS Distribution, a deal that pushed Home Depot beyond the traditional store model and deeper into roofing, landscaping and other specialist construction markets. SRS itself outperformed the company in the second quarter, posting positive comparable sales across all of its verticals as management said it was taking significant share. 

What caught my attention, though, was what management said about the connection between SRS and the rest of the business. Home Depot stores can now access SRS’ full catalogue, allowing sales teams to keep larger orders inside the HD ecosystem rather than sending customers elsewhere. Within the past 12 months, 90% of Home Depot stores had already closed a sale through SRS. 

Home Depot is also giving those customers far more places to do business with it. The company’s 2,364 retail stores now sit alongside more than 1,340 SRS locations, extending its reach into markets and product categories the traditional store network could not serve alone. 

That broader network arrives at a particularly useful moment. The housing market may still be stuck, but Home Depot has spent $18 billion expanding the number of ways it can take share from competitors before housing eventually recovers.

The Stock Still Has A $360 Ceiling

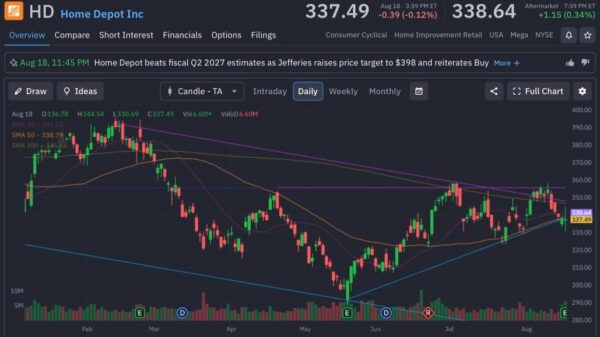
The earnings report landed while Home Depot shares were still wrestling with the same price range they have been stuck in for weeks.

The stock climbed toward $360 in July, only to retreat. August brought another attempt, and that failed too. Each rejection sent shares back toward the low-$330s, where buyers have repeatedly stepped in.

That has created a fairly clear range on the chart: roughly $330 on the downside and $360 overhead.

HD closed the latest session at $337.49, almost directly on its rising 200-day moving average near $338. The stock is also trading below its 20-day and 50-day averages, both of which sit above the current price. That leaves the technical picture unresolved rather than broken.

HD didn’t need a housing recovery to beat expectations this quarter. If the company can keep taking share while the cycle remains weak, the market eventually has to decide whether $360 is still the right place to keep capping the stock.
home depot-StockEarnings

Wall Street Thinks The Worst May Already Be Behind It

I wouldn’t call the housing market healthy because Home Depot posted one good quarter. The company’s own management has already told us it still hasn’t reached an inflection point, and the housing data outside the company gives us no reason to pretend otherwise.

But Wall Street is starting to position for what comes after that.

Jefferies reiterated its Buy rating and raised its price target to $398 from $360, arguing that easier comparisons, market-share gains and more normal storm activity could support the next leg of growth. DA Davidson also maintained its Buy rating, with a $377 price target. 

I’m not buying Home Depot because most news outlets think the housing crisis has disappeared. But the fact that the company just produced its strongest comparable-sales growth since 2022 while the crisis is still here, is quite enticing.

If the housing market remains weak, Home Depot has already shown it can find growth elsewhere. If the market eventually turns, the company walks into that recovery with a much larger Pro ecosystem, more routes to market and evidence that it has already been taking share.


Join over 1.2M+ investors/traders who receive daily and weekly notable earnings alerts with predicted move