ajax loader

Loading...


Ride-the-Wave Strategy – Best for Stock Traders

Ride-the-Wave targets multi-day price momentum following a company’s earnings announcement (EA). With this strategy:

  1. Buy a stock one day post-EA if a stock reacts positively post-earnings:
    1. Near the close of trading the EA-day for a pre-market-EA
    2. Near the close of the following day for a post-market-EA
  2. Sell-to-close after 7-10 days, or possibly earlier if a desired price target is reached

Similarly,

  1. short a stock one day post-EA if a stock reacts negatively post-earnings:
    1. near the close of trading the EA-day for a premarket-EA
    2. near the close of the following day for a post-market-EA
  2. then buy-to-close after 7-10 days, or possibly earlier if a desired price target is reached

Important: Ride-the-Wave is predicated on significant price momentum triggered by an EA. The 7-10 day scenario is the maximum trade hold-time. If you see post EA-momentum is halted or reversed by a significant opposite move, re-evaluate your presence in the trade.

This popular StockEarnings screen below will give you a list of stocks that historically exhibit significant price momentum following an EA for the next seven days:

  1. Stocks exhibiting positive post-EA price moves are buy-candidates
  2. Stocks exhibiting negative post-EA price moves are sell/short-candidates

The screen includes those stocks whose Earnings just came out in last two days.

Screen criteria:

  1. Earnings Date Start Date : Current Date + -1 Day
  2. Earnings Date End Date : Current Date + -2 Days
  3. Predicted Move (Next Day) Max : 7%
  4. Predicted Move (On 7th Day) Min : 7%

Strategy Guideline:

  1. Buy the stock if stock has reacted positively. Short the stock if stock has reacted negatively (see above).
  2. Close the position in 7-10 days, or possibly earlier based on price move.

Volatility Crush Strategy - Best for Options Traders

The Volatility Crush strategy is used with stocks that typically experience relatively low-to-moderate price moves (≤4%) following their Earnings Announcements (EA). The basic trade idea is to sell put or call options right before the EA, collecting a credit when options premium is very high due to elevated implied volatility (IV). You then close the position right after the EA by buying the option back much cheaper due to the significant drop in IV that occurs after the mystery of the EA disappears. In assessing this trade, you need to do your homework to ensure you collect sufficient premium to make the trade worthwhile.

This trade is practical due to the low-to-moderate price-move after the EA, which generally won’t significantly affect the options price, unlike an “action” stock, which experience great price moves post-EA. With these symbols, if you’re on the right side of the price move, that’s a great thing. But if you’re on the wrong side of the move, not so great. Consequently, by minimizing the effect of the post-EA price move, you have a much better chance to profit from the reduction in IV without it being ruined by a violent price move.

For this trade, open the position either (1) the night before the EA when the company announces earnings or (2) during the EA day when it announces post-market, generally capturing IV at or close to its peak.

For this trade, open the position either (1) the night before the EA when the company announces earnings or (2) during the EA day when it announces post-market, generally capturing IV at or close to its peak.

This popular stockearnings screen will give you a list of stocks which do not react more than 4% fpost-EA. It includes only those stocks whose earnings are releasing next day.

Screen criteria:

  1. Earnings Date Start Date : Current Date + 1
  2. Earnings Date End Date : Current Date + 1
  3. Predicted Move (Next Day) Max : 4%
  4. Options Type: Weekly

Strategy Guideline:

  1. Options Strategy: Sell Call and Put
  2. Options Strike Price: Current Stock Price – (% Predicated Move x 2)
  3. Expiration Date: It should generally be the closest expiry immediately after the EA.
  4. Buy Insurance: Buying back Call and Put at Strike price which 10% lower than Sell Strike Price is optional but recommended.

Watch Video for More Detail

Volatility Rush Strategy - Best for Options Traders

The Volatility Rush takes advantage of increasing options premiums into earnings announcements (EA) caused by an anticipated rise in Implied Volatility (IV). With this strategy, Buy a Call and Put at-the-money (a long straddle) 2-3 weeks before the EA when IV is lower. Sell the position either (1) the night before the EA when the company announces earnings pre-market, or (2) during the EA day when it announces post-market, generally capturing IV at or close to its peak.

This popular screen will give you a list of stocks whose Options premiums tend to rise into Earnings. It includes only those stocks whose Earnings are at least two weeks away from today.

Screen criteria:

  1. Earnings Date Start Date : Current Date + 15 Days
  2. Earnings Date End Date : Current Date + 30 Days
  3. Predicted Move (Next Day) Min : 5%
  4. Options Type: Weekly or Monthly if that lines up with the two to three-week lead-time for entering the trade

Strategy Guideline:

  1. Buy a Straddle at or close to the money two to three weeks pre-EA.
  2. Sell the position either the night before the EA when the company announces earnings pre-market, or during the EA day when it announces post-market.
  3. Expiration date should generally be the closest expiry immediately after the EA.
  4. Straddle price should not be more 60% of predicted move.

Predicted Move (Volatility)

Similar to Implied Volatility in Options. Expected volatility % based on our Proprietary Volatility Predication Model. We are expecting that stock price will likely to reach % in either direction by the end of next trading session after Earnings are released and not necessarily the closing volatility %.

Why is it important?

    This indicator helps

  1. Knowing expected volatility in stocks after Earnings helps to decide trading stocks before Earnings Announcement.
  2. Taking Advantage of volatility collapse following Earnings Results by using Advance Options strategies such as Spread and Straddles.

Since Last Earnings

Change in share price since last Earnings release.

Why is it Important?

When share has gained more than 10% since it's last Earning release, it tends to over react to minor bad news and give up some gains if not all. So, it contains more downside volatility than upside When share has dropped more than 10% since it's last Earning release, it tends to over react to minor good news and recover some drops if not all. So, it contains more upside volatility than downside.

EPS Surprise (%)

Occurs when a company's reported quarterly or annual profits are above or below analysts' expectations. Here is the formula to derive % EPS Surprice:

Actual EPS - Estimated EPS
------------------------------------- x 100
Estimated EPS

Why is it Important?

Earnings surprises can have a huge impact on a company's stock price. Several studies suggest that positive earnings surprises not only lead to an immediate hike in a stock's price, but also to a gradual increase over time. Hence, it's not surprising that some companies are known for routinely beating earning projections. A negative earnings surprise will usually result in a decline in share price.

Next Day Price Change (%)

Next Regular trading session Closing price following Earnings result.

For After Market Close Earnings, It is a next trading day closing price. For Before Market Open Earnings, It is the same trading day closing price.

Why is it Important?

Next Day price change is a reaction of Earnings result.

Fabrinet’s $1.3 Billion Quarter Has A $4.2 Million Surprise

Posted on Aug 18, 2026 by Grayson Cavern

Fabrinet’s $1.3 Billion Quarter Has A $4.2 Million Surprise

$4.2 million. That was Fabrinet’s free cash flow for quarter 4 and fiscal 2026, a remarkably small figure sitting underneath a business that just pushed annual revenue to $4.64 billion after Q4 revenue surged 45% year over year to a record $1.316 billion. 

And yet the market’s reaction on was almost comically disconnected from the strength of the headline numbers: Fabrinet (NYSE: FN) closed at $598.58, up 4.97%, before falling to about $556.27 after hours, a roughly 7% reversal.

I don’t think the after-hours reversal is a verdict on Fabrinet’s demand story. It looks more like the market has spotted a bill coming due.

Fabrinet’s AI Surge Is Demanding A Much Bigger Investment


The eye-catching part of Fabrinet’s $4.64 billion fiscal 2026 is not just how much revenue it produced, but how much capital the company had to put behind that growth: $252.5 million in capital expenditures, more than double the $121.1 million spent in FY25. That spending helped push FY26 free cash flow down to just $4.2 million, from $207.3 million a year earlier. 

That is a hell of a commitment to make in one year, but the rest of the balance sheet gives us some context. Inventory climbed from $581 million to $1.02 billion, while accounts receivable increased from $759 million to $1.02 billion. Fabrinet is clearly putting more resources into the business ahead of the demand it expects to serve. 

And management isn’t behaving like the boom is about to disappear. Q1 FY27 guidance calls for $1.375 billion to $1.425 billion in revenue, which would put the company on pace for another record quarter. 

The spending makes more sense when you look at what Fabrinet is preparing for: more capacity, more inventory and a larger operation built to handle the demand coming from its customers. Investors now need that investment to translate into substantially more earnings and cash flow before the price tag starts looking attractive.

Wall Street Is Starting To Treat Fabrinet Like An AI Stock

The market has spent months repricing Fabrinet as investors realize just how much of the AI infrastructure buildout runs through optical connectivity, and that recognition is now showing up in the analyst narrative around the stock. Yahoo Finance’s “13 Best Strong Buy AI Stocks” list? included Fabrinet among its picks, while others argued that the stock may already be approaching fair value after its enormous multi-year run.

I think both views tell us that FN is no longer being valued like an obscure contract manufacturer that happens to benefit from AI spending. Investors are beginning to price it as one of the infrastructure companies that could keep feeding the expansion of data centers, optical networks and high-performance computing.

The underlying business gives them a reason to do it. Fabrinet’s Q4 growth came as optical communications and other high-complexity manufacturing programs continued expanding, while management said multiple significant growth drivers are contributing to the momentum heading into FY27. 

That follows a trend already visible in the previous quarter, when Fabrinet reported $1.214 billion of revenue, up 39%, with data-center interconnect revenue reaching $196.9 million, up 90% year over year.

At the same time, it makes OSI Systems (NASDAQ: OSIS) worth watching as the next data point for the broader electronics and advanced-manufacturing space, with its June-quarter results due August 20 and consensus calling for $3.76 in EPS. Of course, OSI is one of the other stocks operating in Fabrinet’s broader industry group. But the point isn’t that OSI and Fabrinet are interchangeable businesses. They aren’t. It’s that another set of results will give investors a useful read on whether the strength we’re seeing across these specialized manufacturing and infrastructure businesses is broadening.

So I don’t think the AI angle is some convenient story being attached to FN after a good earnings report. The business has been moving toward it quarter after quarter, and the market is finally catching up.

That creates a much tougher standard for the stock from here: when investors start giving a manufacturing company an AI-growth multiple, execution has to keep outrunning expectations.

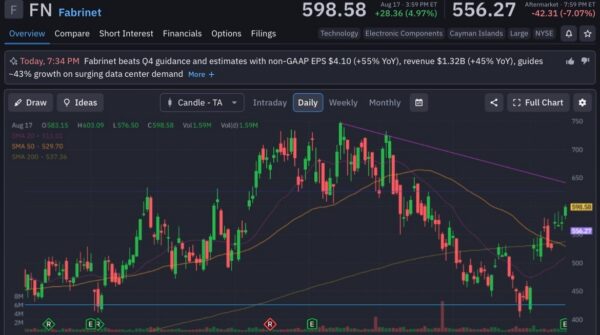
FN Just Reclaimed All Three Major Moving Averages

The chart is actually much stronger than the after-hours reaction makes it look. Fabrinet closed Monday at $598.58, putting the stock comfortably above its 20-day moving average at $511.01, 50-day at $529.70 and 200-day at $537.36, with 1.59 million shares changing hands during the session.

That is a meaningful technical reset after FN spent much of the summer sliding from the $700 area toward the low $400s. The stock has now recovered sharply from that June-July washout, pushed back through the 200-day average and is approaching the $600 area, where the next real test begins.

I would pay particular attention to what happens if the after-hours weakness carries into the next session. Holding the $537-$530 zone would keep the recent recovery intact and turn those moving averages into support; falling back through them would tell us the market wasn’t ready to sustain the post-earnings optimism.

For now, the chart is still leaning bullish. The market may have taken some money off the table after the earnings release, but it hasn’t broken the underlying recovery in FN.
fabrinet-StockEarnings

Bullish, Not Blind To The Price

I’m bullish on what Fabrinet is building, but I’m not going to pretend the stock is asking investors for nothing in return.

The business has earned the right to be taken seriously as a major beneficiary of the optical infrastructure buildout, and the FY27 outlook gives me little reason to think that growth is about to disappear. 

What keeps me from getting carried away is the valuation and the cash conversion. Fabrinet now has to prove that the enormous investment it is making can produce enough incremental earnings and cash to justify the expectations attached to the stock.


Join over 1.2M+ investors/traders who receive daily and weekly notable earnings alerts with predicted move