I’m going to be straight up about the following options trade: betting on Intel (NASDAQ: INTC) is a risky proposition. Sure, INTC stock has gained about 178% on a year-to-date basis but that’s also part of the reason why the ticker presents potential problems for speculators right now. With so much good news baked into the share price, there’s a reasonable assumption that the market is not necessarily eager to build upon its exposure.
Fundamentally, and especially for a long-term perspective, this hesitation appears justified. While artificial intelligence has radically altered the technology landscape, INTC stock has only recently begun accruing the benefits of the innovation. Since rising concerns exist regarding the viability of the tech — particularly related to excess capital expenditures and the timing of future returns on this cash outlay — questions may impose a drag on Intel’s forward outlook.
Nevertheless, from options traders’ perspective, those aren’t always the primary concern. Effectively, even if a company may be fundamentally unsound, the underlying equity may rise (or fall) based on mechanical dynamics. Throughout my portfolio of work for StockEarnings.com, I have focused on these technical elements.
Basically, the idea is that order flow balance — or more specifically order flow imbalances — creates responses by major market participants. I don’t find this view, this presupposition, to be all that unreasonable or controversial. It’s generally accepted that the equities market is reflexive, that it responds to material influences. So, when a public security incurs order flow imbalances, it may result in a corrective response.
For instance, the core of my argument is that INTC stock has incurred a negative order flow over a given time period. When this quantitative circumstance materializes, the historical response is a positive uptick within the first two weeks of the signal flashing (relative to the control dataset). That’s why I’m interested in Intel stock — but there’s also a risk.
I’m looking at the 104/105 bull call spread expiring Aug. 21, this coming Friday.
Acknowledging the Risks Behind the INTC Stock Trade
You can already understand the probabilistic concerns surrounding the above trade. On Friday, Intel stock closed at $102.50. To hit the $105 strike (which would trigger the maximum payout of over 127%), INTC would need to rise 2.44%. That’s a reasonable target if you had a few weeks to work with; here, you only have one week.
And that brings up the risks associated with inductive analysis. On July 17, I published an article for StockEarnings detailing why I believed that the 103/105 bull call spread expiring July 31 represented an intriguing opportunity. Based on the quantitative sequence that INTC stock had flashed at the time, my Markov simulation suggested that the typical response was a gradual, multi-week rise to around the $105 level.
Taking that forecasted information, I felt that the $105 target was a reasonable goal to aim for. But as history will attest, Intel stock closed at $90.20 at the end of July, thus nuking the trade. That the options trade fell short of the goal wasn’t the most frustrating element as every single model of the unknown future will incur losses.
No, what really made the miss frustrating was that on July 21 — just 10 days earlier — Intel stock did in fact breach the $105 level; $105.45 to be precise. In other words, the eventual facts on the ground validated my empirical belief that the ticker would hit the $105 strike. Unfortunately, it hit the target too soon.
Of course, a trader could have made the decision to pull out early but because of the remaining theta on the call spread, the reward would have been less than what would have been generated had INTC stock triggered the second-leg strike at expiration. That’s the major risk with options trade: you can be right with the price and wrong with the time or right with the time and wrong with the price — at the end of the day, you’re still wrong.
So, with only a week to go for this trade, yes, it’s super-risky.
Low IV Could be the Trade’s Saving Grace
Another concern about the Aug. 21 104/105 bull spread is the low implied volatility (IV) for the options chain. Since IV represents the expected range of motion for the underlying security, the actual orders for INTC stock suggest that the equity may not have enough “fuel” to reach the $105 strike at expiration.
At time of writing, the Aug. 21 options chain features an IV of around 65%. Historically, though, the targeted time period typically sees a volatility reading of roughly 78%. So, while it’s not the biggest gap in the world, there is still enough of a variance that is only going to be compounded by the short distance to expiration.
However, a historically high IV can be a double-edged sword for debit-based traders. Because a higher-than-normal IV indicates greater demand for the equity, options traders must pay a higher premium for exposure. That’s going to make the net cost of the derivative strategy more expensive than under a low IV reality. Plus, the higher cost translates to a higher breakeven price, meaning a greater difficulty of success.
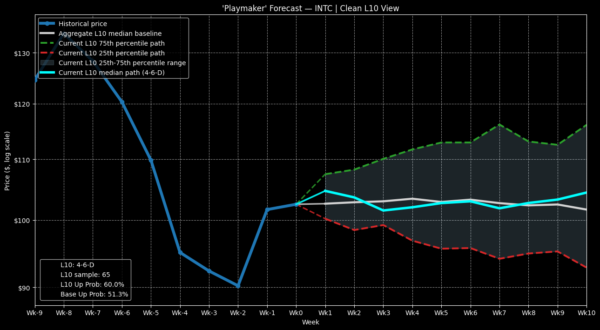
This difficulty ties directly into the Black-Scholes model of pricing options. Fundamentally, Black-Scholes assumes a gradation of probabilistic risk that scales with greater distance between the current spot price and the end target price. For example, a second-leg strike of $105 will always be more difficult to reach on the long debit side than a second-leg strike of $104 or $104.50.
Nevertheless, real market dynamics don’t necessarily scale risk to distance. This relationship would be true if you assumed a risk-free, lognormal and random environment, as Black-Scholes does. But if you assume that the equities market is nonrandom — and that this nonrandomness can be exacerbated under specific quantitative structures — you may be able to get in front of the probabilistic wave.
To put it simply, Black-Sholes uses IV to calculate the urgency by which INTC stock may travel. I’m using quant sequences for this urgency, which makes IV slightly less of a concern.
Negative Order Flow May Lead to a Reaction
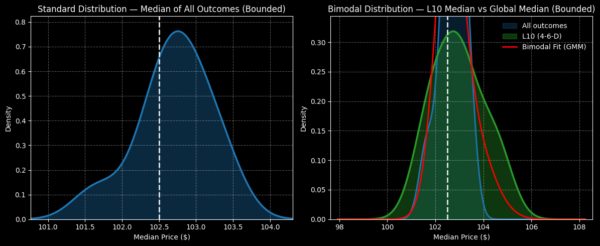
Now, the order flow imbalance that I’m looking at is that in the last 10 weeks, INTC stock has printed four up weeks, leading to a downward slope. Over the next 10 weeks, the resultant performance following this 4-6-D signal isn’t that much different against the control group data or the random baseline. But in the first two weeks (and especially the first), there’s a conspicuous historical lift.
Since January 2019, of the 65 times that the 4-6-D signal has flashed, Intel stock has exceeded the equivalent of the $105 strike price a total of 29 times at the end of week 1 (Aug. 21). The math comes out to a 44.6% observed probability of full profitability.
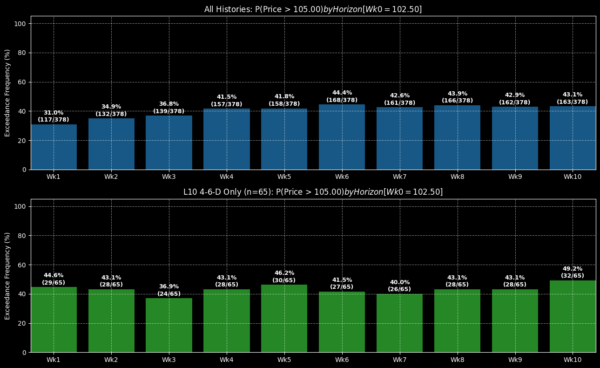
Interestingly, if you run an expected value (EV) calculation, this trade over the theoretical long run should elicit a net gain of 60 cents. While these numbers don’t necessarily reflect what might happen this week, assuming that the model above is an accurate representation of reality, you may be looking at an efficient trade.
Ultimately, you’re paying $44 for the chance to make a profit of $56. Statistically, whether you rely on Black-Scholes or an inductive model, you’re looking at a low-odds situation. However, my argument is that the negative order flow that we see in the charts has statistically led to a near-term lift.
This trend isn’t guaranteed to repeat so it’s not wise to throw at the transaction money you can’t afford to lose. Still, if you have some loose change — pejoratively known as “stupid money” — lying around, there are worse ways to spend 44 bucks.

