ajax loader

Loading...


Ride-the-Wave Strategy – Best for Stock Traders

Ride-the-Wave targets multi-day price momentum following a company’s earnings announcement (EA). With this strategy:

  1. Buy a stock one day post-EA if a stock reacts positively post-earnings:
    1. Near the close of trading the EA-day for a pre-market-EA
    2. Near the close of the following day for a post-market-EA
  2. Sell-to-close after 7-10 days, or possibly earlier if a desired price target is reached

Similarly,

  1. short a stock one day post-EA if a stock reacts negatively post-earnings:
    1. near the close of trading the EA-day for a premarket-EA
    2. near the close of the following day for a post-market-EA
  2. then buy-to-close after 7-10 days, or possibly earlier if a desired price target is reached

Important: Ride-the-Wave is predicated on significant price momentum triggered by an EA. The 7-10 day scenario is the maximum trade hold-time. If you see post EA-momentum is halted or reversed by a significant opposite move, re-evaluate your presence in the trade.

This popular StockEarnings screen below will give you a list of stocks that historically exhibit significant price momentum following an EA for the next seven days:

  1. Stocks exhibiting positive post-EA price moves are buy-candidates
  2. Stocks exhibiting negative post-EA price moves are sell/short-candidates

The screen includes those stocks whose Earnings just came out in last two days.

Screen criteria:

  1. Earnings Date Start Date : Current Date + -1 Day
  2. Earnings Date End Date : Current Date + -2 Days
  3. Predicted Move (Next Day) Max : 7%
  4. Predicted Move (On 7th Day) Min : 7%

Strategy Guideline:

  1. Buy the stock if stock has reacted positively. Short the stock if stock has reacted negatively (see above).
  2. Close the position in 7-10 days, or possibly earlier based on price move.

Volatility Crush Strategy - Best for Options Traders

The Volatility Crush strategy is used with stocks that typically experience relatively low-to-moderate price moves (≤4%) following their Earnings Announcements (EA). The basic trade idea is to sell put or call options right before the EA, collecting a credit when options premium is very high due to elevated implied volatility (IV). You then close the position right after the EA by buying the option back much cheaper due to the significant drop in IV that occurs after the mystery of the EA disappears. In assessing this trade, you need to do your homework to ensure you collect sufficient premium to make the trade worthwhile.

This trade is practical due to the low-to-moderate price-move after the EA, which generally won’t significantly affect the options price, unlike an “action” stock, which experience great price moves post-EA. With these symbols, if you’re on the right side of the price move, that’s a great thing. But if you’re on the wrong side of the move, not so great. Consequently, by minimizing the effect of the post-EA price move, you have a much better chance to profit from the reduction in IV without it being ruined by a violent price move.

For this trade, open the position either (1) the night before the EA when the company announces earnings or (2) during the EA day when it announces post-market, generally capturing IV at or close to its peak.

For this trade, open the position either (1) the night before the EA when the company announces earnings or (2) during the EA day when it announces post-market, generally capturing IV at or close to its peak.

This popular stockearnings screen will give you a list of stocks which do not react more than 4% fpost-EA. It includes only those stocks whose earnings are releasing next day.

Screen criteria:

  1. Earnings Date Start Date : Current Date + 1
  2. Earnings Date End Date : Current Date + 1
  3. Predicted Move (Next Day) Max : 4%
  4. Options Type: Weekly

Strategy Guideline:

  1. Options Strategy: Sell Call and Put
  2. Options Strike Price: Current Stock Price – (% Predicated Move x 2)
  3. Expiration Date: It should generally be the closest expiry immediately after the EA.
  4. Buy Insurance: Buying back Call and Put at Strike price which 10% lower than Sell Strike Price is optional but recommended.

Watch Video for More Detail

Volatility Rush Strategy - Best for Options Traders

The Volatility Rush takes advantage of increasing options premiums into earnings announcements (EA) caused by an anticipated rise in Implied Volatility (IV). With this strategy, Buy a Call and Put at-the-money (a long straddle) 2-3 weeks before the EA when IV is lower. Sell the position either (1) the night before the EA when the company announces earnings pre-market, or (2) during the EA day when it announces post-market, generally capturing IV at or close to its peak.

This popular screen will give you a list of stocks whose Options premiums tend to rise into Earnings. It includes only those stocks whose Earnings are at least two weeks away from today.

Screen criteria:

  1. Earnings Date Start Date : Current Date + 15 Days
  2. Earnings Date End Date : Current Date + 30 Days
  3. Predicted Move (Next Day) Min : 5%
  4. Options Type: Weekly or Monthly if that lines up with the two to three-week lead-time for entering the trade

Strategy Guideline:

  1. Buy a Straddle at or close to the money two to three weeks pre-EA.
  2. Sell the position either the night before the EA when the company announces earnings pre-market, or during the EA day when it announces post-market.
  3. Expiration date should generally be the closest expiry immediately after the EA.
  4. Straddle price should not be more 60% of predicted move.

Predicted Move (Volatility)

Similar to Implied Volatility in Options. Expected volatility % based on our Proprietary Volatility Predication Model. We are expecting that stock price will likely to reach % in either direction by the end of next trading session after Earnings are released and not necessarily the closing volatility %.

Why is it important?

    This indicator helps

  1. Knowing expected volatility in stocks after Earnings helps to decide trading stocks before Earnings Announcement.
  2. Taking Advantage of volatility collapse following Earnings Results by using Advance Options strategies such as Spread and Straddles.

Since Last Earnings

Change in share price since last Earnings release.

Why is it Important?

When share has gained more than 10% since it's last Earning release, it tends to over react to minor bad news and give up some gains if not all. So, it contains more downside volatility than upside When share has dropped more than 10% since it's last Earning release, it tends to over react to minor good news and recover some drops if not all. So, it contains more upside volatility than downside.

EPS Surprise (%)

Occurs when a company's reported quarterly or annual profits are above or below analysts' expectations. Here is the formula to derive % EPS Surprice:

Actual EPS - Estimated EPS
------------------------------------- x 100
Estimated EPS

Why is it Important?

Earnings surprises can have a huge impact on a company's stock price. Several studies suggest that positive earnings surprises not only lead to an immediate hike in a stock's price, but also to a gradual increase over time. Hence, it's not surprising that some companies are known for routinely beating earning projections. A negative earnings surprise will usually result in a decline in share price.

Next Day Price Change (%)

Next Regular trading session Closing price following Earnings result.

For After Market Close Earnings, It is a next trading day closing price. For Before Market Open Earnings, It is the same trading day closing price.

Why is it Important?

Next Day price change is a reaction of Earnings result.

Down 19% YTD, Domino’s Pizza (DPZ) Stock Looks Yummy

Posted on Aug 18, 2026 by Chris Markoch

Down 19% YTD, Domino’s Pizza (DPZ) Stock Looks Yummy

Domino’s Pizza (NASDAQ: DPZ) has had a rough 2026, down roughly 19% year to date. Yet a close look at the numbers doesn’t reveal an obvious reason for the slide. Adjusted earnings per share (EPS) have been lumpy quarter to quarter, but the underlying trend remains solid. Q2 2026 revenue climbed 4.3% year over year to $1.19 billion, with diluted EPS rising to $4.07 from $3.81 a year earlier. That’s not the profile of a company falling apart.

Instead, this looks like a case of perception outrunning fundamentals. Investors accustomed to punchier growth may be recalibrating expectations downward, and the stock is paying the price. But for value-minded investors, that gap between narrative and reality can be exactly where opportunity lives. Domino’s still dominates its category, continues to grow its store count, and pays a rising dividend. The question is whether the market has overcorrected.

Below, we’ll unpack the valuation case, the football season and dividend tailwinds, what the chart is telling technical traders, and the risks worth watching before Domino’s reports again in October.

Domino’s Pizza Stock Looks Undervalued at 19.6 Times Earnings


Valuation is where the Domino’s story gets interesting. As of Aug. 18, the stock currently trades on a P/E of roughly 19.6x, well below both the hospitality industry average of 23x and its own historical norms. That’s also cheaper than the broader S&P 500, which has typically commanded a richer multiple than a franchise-heavy, cash-generative business like Domino’s.

Discounted cash flow models have pegged fair value near $408, implying roughly a 25% discount to the current share price. Multiple approaches point in the same direction.

None of this guarantees a rebound on any particular timeline. But when several independent valuation methods land on “undervalued,” it’s worth asking whether the market’s pessimism has run ahead of the actual business results Domino’s keeps posting quarter after quarter.

A Growing Dividend and Football Season Add to Domino’s Appeal

Domino’s also offers something increasingly rare: a growing dividend backed by real cash flow. The stock yields about 2.37% today, and the company has raised its payout for 12 consecutive years. More striking is the pace — the five-year annualized dividend growth rate tops 17%, far outrunning inflation and most income alternatives.

Timing adds another wrinkle. Football season is underway, and pizza delivery has long ridden shotgun with Sunday kickoffs and Monday night matchups. It’s a seasonal tailwind that’s easy to dismiss as anecdotal, but it’s also one Domino’s has leaned on successfully for decades. Combined with steady same-store sales and a fresh wave of new locations, the setup favors patient income investors more than headline chasers.
domino's - StockEarnings

DPZ Reclaims Its 200-Day Moving Average

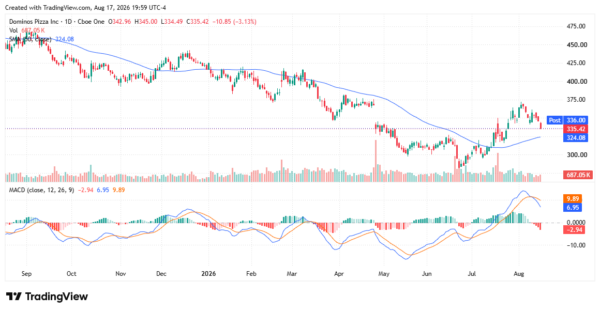
The technical picture has quietly improved. After bottoming near $300 in July, DPZ has climbed back above its 200-day moving average, a classic bullish signal often called a golden cross. Price action has formed a series of higher lows since the spring bottom, and the MACD has crossed into positive territory, with both lines trending upward.

Volume has picked up on green days, hinting at accumulation rather than distribution. Resistance sits near $345–$350, an area the stock is testing now. A clean break above that zone, on strong volume, would strengthen the case that this is a genuine trend reversal rather than a temporary bounce.
domino's - StockEarnings

Weak U.S. Sales and Consumer Spending Are Key Domino’s Risks

Not everything is rosy. Q2’s U.S. same-store sales grew just 0.1%, the weakest quarterly performance in more than a year, and diluted EPS missed Wall Street’s $4.17 estimate. That’s a real signal of consumer softness, not just noise.

July’s retail sales report added to the worry. Headline sales fell 0.6% from June, well below expectations, and consumer sentiment dropped sharply in early August. If shoppers keep pulling back, Domino’s may need heavier promotions to defend traffic, squeezing margins.

GLP-1 drugs remain a lingering overhang for restaurant stocks broadly, even though Domino’s sales keep growing rather than shrinking. A leadership transition at the top adds one more variable investors will be watching closely. None of these is a dealbreaker on its own, but together they explain why some investors remain cautious.

Domino’s Pizza Stock Offers Value, Income and Rebound Potential

Domino’s Pizza isn’t broken. Revenue keeps growing, the dividend keeps rising, and multiple valuation methods suggest the stock trades below the business’s intrinsic value. The 19% pullback looks more like a reset in expectations than a warning about the underlying company.

Football season, a strengthening chart, and a well-covered dividend all argue for patience here. The real test comes in October, when Domino’s reports next and investors learn whether July’s soft retail data was a blip or the start of something bigger. Until then, analysts still see meaningful upside from current levels — and that’s a story worth watching.


A former marketing copywriter turned freelance financial writer and market analyst. I have a passion for delivering insights to investors. I write regularly about stocks for StockEarnings and MarketBeat. Posts are not advice.

Join over 1.2M+ investors/traders who receive daily and weekly notable earnings alerts with predicted move