ajax loader

Loading...


Ride-the-Wave Strategy – Best for Stock Traders

Ride-the-Wave targets multi-day price momentum following a company’s earnings announcement (EA). With this strategy:

  1. Buy a stock one day post-EA if a stock reacts positively post-earnings:
    1. Near the close of trading the EA-day for a pre-market-EA
    2. Near the close of the following day for a post-market-EA
  2. Sell-to-close after 7-10 days, or possibly earlier if a desired price target is reached

Similarly,

  1. short a stock one day post-EA if a stock reacts negatively post-earnings:
    1. near the close of trading the EA-day for a premarket-EA
    2. near the close of the following day for a post-market-EA
  2. then buy-to-close after 7-10 days, or possibly earlier if a desired price target is reached

Important: Ride-the-Wave is predicated on significant price momentum triggered by an EA. The 7-10 day scenario is the maximum trade hold-time. If you see post EA-momentum is halted or reversed by a significant opposite move, re-evaluate your presence in the trade.

This popular StockEarnings screen below will give you a list of stocks that historically exhibit significant price momentum following an EA for the next seven days:

  1. Stocks exhibiting positive post-EA price moves are buy-candidates
  2. Stocks exhibiting negative post-EA price moves are sell/short-candidates

The screen includes those stocks whose Earnings just came out in last two days.

Screen criteria:

  1. Earnings Date Start Date : Current Date + -1 Day
  2. Earnings Date End Date : Current Date + -2 Days
  3. Predicted Move (Next Day) Max : 7%
  4. Predicted Move (On 7th Day) Min : 7%

Strategy Guideline:

  1. Buy the stock if stock has reacted positively. Short the stock if stock has reacted negatively (see above).
  2. Close the position in 7-10 days, or possibly earlier based on price move.

Volatility Crush Strategy - Best for Options Traders

The Volatility Crush strategy is used with stocks that typically experience relatively low-to-moderate price moves (≤4%) following their Earnings Announcements (EA). The basic trade idea is to sell put or call options right before the EA, collecting a credit when options premium is very high due to elevated implied volatility (IV). You then close the position right after the EA by buying the option back much cheaper due to the significant drop in IV that occurs after the mystery of the EA disappears. In assessing this trade, you need to do your homework to ensure you collect sufficient premium to make the trade worthwhile.

This trade is practical due to the low-to-moderate price-move after the EA, which generally won’t significantly affect the options price, unlike an “action” stock, which experience great price moves post-EA. With these symbols, if you’re on the right side of the price move, that’s a great thing. But if you’re on the wrong side of the move, not so great. Consequently, by minimizing the effect of the post-EA price move, you have a much better chance to profit from the reduction in IV without it being ruined by a violent price move.

For this trade, open the position either (1) the night before the EA when the company announces earnings or (2) during the EA day when it announces post-market, generally capturing IV at or close to its peak.

For this trade, open the position either (1) the night before the EA when the company announces earnings or (2) during the EA day when it announces post-market, generally capturing IV at or close to its peak.

This popular stockearnings screen will give you a list of stocks which do not react more than 4% fpost-EA. It includes only those stocks whose earnings are releasing next day.

Screen criteria:

  1. Earnings Date Start Date : Current Date + 1
  2. Earnings Date End Date : Current Date + 1
  3. Predicted Move (Next Day) Max : 4%
  4. Options Type: Weekly

Strategy Guideline:

  1. Options Strategy: Sell Call and Put
  2. Options Strike Price: Current Stock Price – (% Predicated Move x 2)
  3. Expiration Date: It should generally be the closest expiry immediately after the EA.
  4. Buy Insurance: Buying back Call and Put at Strike price which 10% lower than Sell Strike Price is optional but recommended.

Watch Video for More Detail

Volatility Rush Strategy - Best for Options Traders

The Volatility Rush takes advantage of increasing options premiums into earnings announcements (EA) caused by an anticipated rise in Implied Volatility (IV). With this strategy, Buy a Call and Put at-the-money (a long straddle) 2-3 weeks before the EA when IV is lower. Sell the position either (1) the night before the EA when the company announces earnings pre-market, or (2) during the EA day when it announces post-market, generally capturing IV at or close to its peak.

This popular screen will give you a list of stocks whose Options premiums tend to rise into Earnings. It includes only those stocks whose Earnings are at least two weeks away from today.

Screen criteria:

  1. Earnings Date Start Date : Current Date + 15 Days
  2. Earnings Date End Date : Current Date + 30 Days
  3. Predicted Move (Next Day) Min : 5%
  4. Options Type: Weekly or Monthly if that lines up with the two to three-week lead-time for entering the trade

Strategy Guideline:

  1. Buy a Straddle at or close to the money two to three weeks pre-EA.
  2. Sell the position either the night before the EA when the company announces earnings pre-market, or during the EA day when it announces post-market.
  3. Expiration date should generally be the closest expiry immediately after the EA.
  4. Straddle price should not be more 60% of predicted move.

Predicted Move (Volatility)

Similar to Implied Volatility in Options. Expected volatility % based on our Proprietary Volatility Predication Model. We are expecting that stock price will likely to reach % in either direction by the end of next trading session after Earnings are released and not necessarily the closing volatility %.

Why is it important?

    This indicator helps

  1. Knowing expected volatility in stocks after Earnings helps to decide trading stocks before Earnings Announcement.
  2. Taking Advantage of volatility collapse following Earnings Results by using Advance Options strategies such as Spread and Straddles.

Since Last Earnings

Change in share price since last Earnings release.

Why is it Important?

When share has gained more than 10% since it's last Earning release, it tends to over react to minor bad news and give up some gains if not all. So, it contains more downside volatility than upside When share has dropped more than 10% since it's last Earning release, it tends to over react to minor good news and recover some drops if not all. So, it contains more upside volatility than downside.

EPS Surprise (%)

Occurs when a company's reported quarterly or annual profits are above or below analysts' expectations. Here is the formula to derive % EPS Surprice:

Actual EPS - Estimated EPS
------------------------------------- x 100
Estimated EPS

Why is it Important?

Earnings surprises can have a huge impact on a company's stock price. Several studies suggest that positive earnings surprises not only lead to an immediate hike in a stock's price, but also to a gradual increase over time. Hence, it's not surprising that some companies are known for routinely beating earning projections. A negative earnings surprise will usually result in a decline in share price.

Next Day Price Change (%)

Next Regular trading session Closing price following Earnings result.

For After Market Close Earnings, It is a next trading day closing price. For Before Market Open Earnings, It is the same trading day closing price.

Why is it Important?

Next Day price change is a reaction of Earnings result.

If You’ve Got the Appetite, AMAT Should Be on Your Radar

Posted on Aug 21, 2026 by Joshua Enomoto

If You’ve Got the Appetite, AMAT Should Be on Your Radar

For those seeking an unconventional — and thus highly risky — options trade, Applied Materials (NASDAQ: AMAT) may be a name to consider. While the year-to-date performance of AMAT stock is strong, up 93%, it has struggled in recent sessions. In the trailing month, the ticker lost roughly 6% of market value. Yet the extended drag could lead to a potential mean reversion.

How can I tell? Obviously, no one knows what the future will entail. But we do know that Applied Materials stock is relevant to the current tech ecosystem. Primarily, the company supplies equipment, services and software for the manufacture of semiconductor chips for electronics, flat panel displays for computers, smartphones, televisions and solar products, according to Google Finance. Better yet, artificial intelligence plays a major role in AMAT’s forward trajectory.

Rather than designing advanced chips, Applied Materials supplies the materials engineering and manufacturing equipment needed to produce AI chips. In other words, Applied is a picks-and-shovels play for the machine intelligence boom. Practically speaking, the runway should be indefinitely long for AMAT stock.

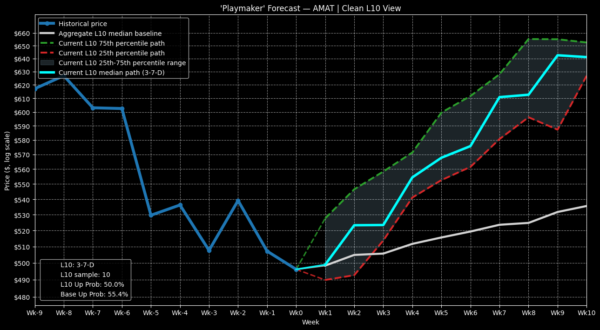
If so, any extended weakness in the name should entice professional players to view the ticker as a discounted opportunity. Quantitatively, we should note that in the last 10 weeks, AMAT stock has only printed three positive weekly candlesticks.

How many times has that happened? Since January 2019, the quant sequence has only flashed a total of 10 times on a rolling basis. By itself, this structure only represents a factoid. But it’s what happens when this signal does flash that’s most intriguing.

Based on past empirical data, the median expectation at the end of the fourth week since the materialization of the signal is a swing up of approximately 11.3%. If so, the 530/550 bull call spread expiring Sep. 18 looks intriguing.

Analyzing the Assumptions Undergirding AMAT Stock


What can be absolutely said about the future of Applied Materials stock or any other public security? From an epistemological point of view, absolutely nothing. We can’t even say that the future will occur sequentially because even the concepts of “before” and “after” are presuppositional.

I’m sorry but the very concept that just because we observe time in a linear sequence does not mean with absolute certainty that time operates in that manner. That’s why I don’t like these “creation-requires-a-creator” theological arguments. Who says that the universe is a creation? It could be but empirically, we’re dealing with yet another presupposition.

What’s my point? If we’re making arguments about the unknown future, they’re necessarily presuppositional. And that’s important to realize because this means that you shouldn’t automatically privilege Wall Street-derived probabilities as the gold standard — frankly, they could be wrong.

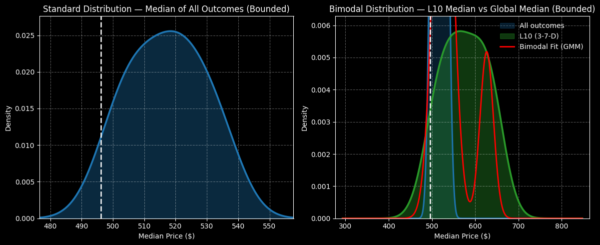
For example, the breakeven price for the above 530/550 bull spread is defined as $538. The Street happens to assign an implied probability of breakeven of only 30.7%. Further, the probability distribution screener reveals that the chance of AMAT stock triggering the $550 strike at expiration is only about 25.5%.
AMAT-StockEarnings

You don’t need me to tell you that’s super-low and as such, debit traders would likely avoid the 530/550 spread simply because of the low odds of being profitable. Indeed, you wouldn’t have to run an expected value (EV) calculation because it’s obvious you would bleed money over the theoretical long run.

Why are these probabilities so low? Wall Street makes its calculations based on the Black-Scholes family of options pricing models. Under this framework, it’s assumed that AMAT stock will undergo a random walk from now until the expiration date. With each session within this period incurring random behavior, the implied probability of AMAT hitting $550 at expiration comes out to a sterile, modest calculation.
AMAT-StockEarnings

Here’s the question you really need to be asking, though: is it reasonable to believe that Applied Materials stock will indeed undergo a random walk? AMAT only managed to print three up weeks in the last 10 weeks, so no, I don’t believe the next 10 weeks will be random.

Personally, I anticipate nonrandom behavior, primarily because I’m presupposing that institutional players are looking at the long string of down sessions as a buy-the-dip opportunity.

Defending the Nonrandom Presupposition of Applied Materials Stock

Obviously, I have no way of guaranteeing that the immediate future of AMAT stock will be nonrandom. It could be random, that’s ultimately up to the market to decide. But what can be said is that whenever AMAT flashed the 3-7-D quant sequence (3 up weeks, 7 down weeks, downward slope), the historical outlook has been robustly positive.

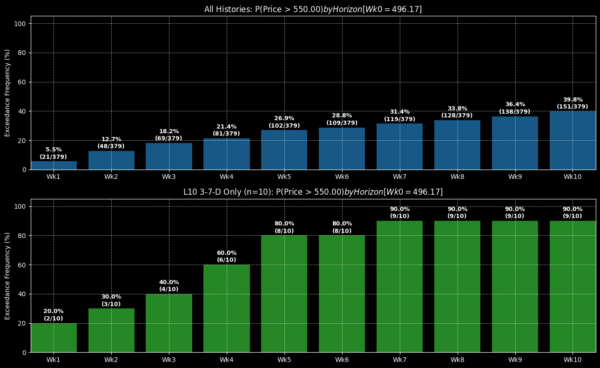
How robust? Out of the 10 times that the signal has flashed, Applied Materials stock has exceeded the equivalent of the $550 strike a total of six times at the end of week 4 (Sep. 18). Of course, we have to exercise intense caution here because a sample size of n=10 just isn’t scientific. Still, if we deliberately look at the picture from a statistically naïve perspective, we would be looking at a 60% success ratio.
AMAT-StockEarnings

If that were actually the case, the 530/550 bull spread would generate a positive EV over the theoretical long run because you would be winning more money than losing it. But is this inductive model trustworthy?

Here, I’m definitely torn. I do find the 530/550 spread mathematically intriguing because of the historical pattern that has been established. Unfortunately, there’s no way to pin this down with confidence. As I stated, the sample size is too small.

It’s going to come down to your own personal risk tolerance. Because the signal itself is so rare, it’s natural to presume that there’s power or influence in this signal. Again, you’d have to make the decision yourself.

Another Risk to Consider

Unlike other debit spreads that I’ve discussed, this one has a high net cost. Each spread requires a net debit (cash outlay) of $800. That’s not chump change. On the other end of the equation, the maximum profit for this trade is $1,200.

To summarize, if you believe that AMAT stock will travel along a random journey over the next few weeks, you’re looking at a probabilistically risky trade that you should consider avoiding. However, if you anticipate nonrandom behavior, there is an argument that Applied Materials could be underpriced.

It’s amazing what a change of presuppositions can do for you. Just remember, presuppositions are not necessarily valid until they’re actually confirmed by the targeted event itself.


Joshua Enomoto is a seasoned financial writer with a strong track record of in-depth stock analysis, offering clear, insightful commentary for retail investors across all levels of expertise. Renowned for his ability to blend analytical rigor with engaging wit, Joshua's work has been featured on leading investment platforms, including TipRanks, InvestorPlace, Barchart, Benzinga, and Fintel. He was also handpicked to spearhead high-impact initiatives such as InvestorPlace's "Trade of the Day" and Benzinga’s ETF coverage. As a frequent guest expert for CGTN America, Joshua discusses a wide range of economic, societal, and consumer market trends. A graduate of U.C. San Diego, Joshua brings a thoughtful and fresh perspective to complex financial narratives, helping enterprise clients connect with their audiences. He also composes music in his spare time.

Join over 1.2M+ investors/traders who receive daily and weekly notable earnings alerts with predicted move