ajax loader

Loading...


Ride-the-Wave Strategy – Best for Stock Traders

Ride-the-Wave targets multi-day price momentum following a company’s earnings announcement (EA). With this strategy:

  1. Buy a stock one day post-EA if a stock reacts positively post-earnings:
    1. Near the close of trading the EA-day for a pre-market-EA
    2. Near the close of the following day for a post-market-EA
  2. Sell-to-close after 7-10 days, or possibly earlier if a desired price target is reached

Similarly,

  1. short a stock one day post-EA if a stock reacts negatively post-earnings:
    1. near the close of trading the EA-day for a premarket-EA
    2. near the close of the following day for a post-market-EA
  2. then buy-to-close after 7-10 days, or possibly earlier if a desired price target is reached

Important: Ride-the-Wave is predicated on significant price momentum triggered by an EA. The 7-10 day scenario is the maximum trade hold-time. If you see post EA-momentum is halted or reversed by a significant opposite move, re-evaluate your presence in the trade.

This popular StockEarnings screen below will give you a list of stocks that historically exhibit significant price momentum following an EA for the next seven days:

  1. Stocks exhibiting positive post-EA price moves are buy-candidates
  2. Stocks exhibiting negative post-EA price moves are sell/short-candidates

The screen includes those stocks whose Earnings just came out in last two days.

Screen criteria:

  1. Earnings Date Start Date : Current Date + -1 Day
  2. Earnings Date End Date : Current Date + -2 Days
  3. Predicted Move (Next Day) Max : 7%
  4. Predicted Move (On 7th Day) Min : 7%

Strategy Guideline:

  1. Buy the stock if stock has reacted positively. Short the stock if stock has reacted negatively (see above).
  2. Close the position in 7-10 days, or possibly earlier based on price move.

Volatility Crush Strategy - Best for Options Traders

The Volatility Crush strategy is used with stocks that typically experience relatively low-to-moderate price moves (≤4%) following their Earnings Announcements (EA). The basic trade idea is to sell put or call options right before the EA, collecting a credit when options premium is very high due to elevated implied volatility (IV). You then close the position right after the EA by buying the option back much cheaper due to the significant drop in IV that occurs after the mystery of the EA disappears. In assessing this trade, you need to do your homework to ensure you collect sufficient premium to make the trade worthwhile.

This trade is practical due to the low-to-moderate price-move after the EA, which generally won’t significantly affect the options price, unlike an “action” stock, which experience great price moves post-EA. With these symbols, if you’re on the right side of the price move, that’s a great thing. But if you’re on the wrong side of the move, not so great. Consequently, by minimizing the effect of the post-EA price move, you have a much better chance to profit from the reduction in IV without it being ruined by a violent price move.

For this trade, open the position either (1) the night before the EA when the company announces earnings or (2) during the EA day when it announces post-market, generally capturing IV at or close to its peak.

For this trade, open the position either (1) the night before the EA when the company announces earnings or (2) during the EA day when it announces post-market, generally capturing IV at or close to its peak.

This popular stockearnings screen will give you a list of stocks which do not react more than 4% fpost-EA. It includes only those stocks whose earnings are releasing next day.

Screen criteria:

  1. Earnings Date Start Date : Current Date + 1
  2. Earnings Date End Date : Current Date + 1
  3. Predicted Move (Next Day) Max : 4%
  4. Options Type: Weekly

Strategy Guideline:

  1. Options Strategy: Sell Call and Put
  2. Options Strike Price: Current Stock Price – (% Predicated Move x 2)
  3. Expiration Date: It should generally be the closest expiry immediately after the EA.
  4. Buy Insurance: Buying back Call and Put at Strike price which 10% lower than Sell Strike Price is optional but recommended.

Watch Video for More Detail

Volatility Rush Strategy - Best for Options Traders

The Volatility Rush takes advantage of increasing options premiums into earnings announcements (EA) caused by an anticipated rise in Implied Volatility (IV). With this strategy, Buy a Call and Put at-the-money (a long straddle) 2-3 weeks before the EA when IV is lower. Sell the position either (1) the night before the EA when the company announces earnings pre-market, or (2) during the EA day when it announces post-market, generally capturing IV at or close to its peak.

This popular screen will give you a list of stocks whose Options premiums tend to rise into Earnings. It includes only those stocks whose Earnings are at least two weeks away from today.

Screen criteria:

  1. Earnings Date Start Date : Current Date + 15 Days
  2. Earnings Date End Date : Current Date + 30 Days
  3. Predicted Move (Next Day) Min : 5%
  4. Options Type: Weekly or Monthly if that lines up with the two to three-week lead-time for entering the trade

Strategy Guideline:

  1. Buy a Straddle at or close to the money two to three weeks pre-EA.
  2. Sell the position either the night before the EA when the company announces earnings pre-market, or during the EA day when it announces post-market.
  3. Expiration date should generally be the closest expiry immediately after the EA.
  4. Straddle price should not be more 60% of predicted move.

Predicted Move (Volatility)

Similar to Implied Volatility in Options. Expected volatility % based on our Proprietary Volatility Predication Model. We are expecting that stock price will likely to reach % in either direction by the end of next trading session after Earnings are released and not necessarily the closing volatility %.

Why is it important?

    This indicator helps

  1. Knowing expected volatility in stocks after Earnings helps to decide trading stocks before Earnings Announcement.
  2. Taking Advantage of volatility collapse following Earnings Results by using Advance Options strategies such as Spread and Straddles.

Since Last Earnings

Change in share price since last Earnings release.

Why is it Important?

When share has gained more than 10% since it's last Earning release, it tends to over react to minor bad news and give up some gains if not all. So, it contains more downside volatility than upside When share has dropped more than 10% since it's last Earning release, it tends to over react to minor good news and recover some drops if not all. So, it contains more upside volatility than downside.

EPS Surprise (%)

Occurs when a company's reported quarterly or annual profits are above or below analysts' expectations. Here is the formula to derive % EPS Surprice:

Actual EPS - Estimated EPS
------------------------------------- x 100
Estimated EPS

Why is it Important?

Earnings surprises can have a huge impact on a company's stock price. Several studies suggest that positive earnings surprises not only lead to an immediate hike in a stock's price, but also to a gradual increase over time. Hence, it's not surprising that some companies are known for routinely beating earning projections. A negative earnings surprise will usually result in a decline in share price.

Next Day Price Change (%)

Next Regular trading session Closing price following Earnings result.

For After Market Close Earnings, It is a next trading day closing price. For Before Market Open Earnings, It is the same trading day closing price.

Why is it Important?

Next Day price change is a reaction of Earnings result.

Volatility-Proof Dividend ETFs for Steady Income in Any Market

Posted on May 08, 2026 by Ian Cooper

Volatility-Proof Dividend ETFs for Steady Income in Any Market

Market volatility can test even the most patient investors, especially when sharp swings in stock prices dominate headlines. But for investors focused on steady income, volatility doesn’t have to derail a long-term strategy. In fact, dividend ETFs can help provide stability, consistent cash flow, and peace of mind during uncertain markets.

Dividend ETFs give investors exposure to diversified baskets of companies with strong histories of paying and growing shareholder payouts. Many of these businesses are mature, financially stable firms capable of generating reliable cash flow even during economic slowdowns. That combination of diversification, dependable income, and lower stress makes dividend ETFs especially attractive for retirees and conservative investors.

For investors looking to build volatility-resistant portfolios, these three dividend ETFs stand out for their history of reliable payouts and strong underlying holdings.

SPDR S&P Dividend ETF Offers Reliable Dividend Growth


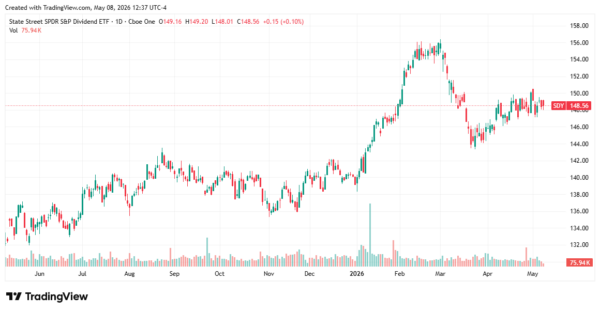
The SPDR S&P Dividend ETF (NYSEARCA: SDY) invests in companies that have increased dividends for at least 20 consecutive years. With an expense ratio of 0.35%, the ETF yields about 2.46% and gives investors exposure to some of the market’s most dependable dividend payers.

These companies have maintained and increased payouts through major market disruptions, including the dot-com crash, the 2008 financial crisis, and the COVID-19 pandemic. That consistency can help investors stay confident during periods of uncertainty.

Some of SDY’s top holdings include Verizon (NYSE: VZ), Realty Income (NYSE: O), Target (NYSE: TGT), Chevron (NYSE: CVX), Kimberly-Clark (NYSE: KMB), and Exxon Mobil (NYSE: XOM). These companies operate in defensive industries and generate the kind of steady cash flow that supports long-term dividend growth.

dividend etfs - StockEarnings

Invesco SPHD Combines High Dividend Yield With Low Volatility

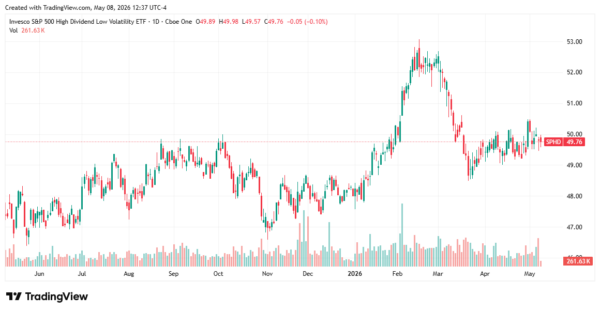
With an expense ratio of 0.30%, the Invesco S&P 500 High Dividend Low Volatility ETF (NYSEARCA: SPHD) focuses on two key investor priorities: strong dividend income and reduced volatility. The ETF currently offers a yield of approximately 4.66%, making it especially attractive for retirees and income-focused investors.

One of SPHD’s biggest advantages is its monthly dividend payout schedule. Monthly payments can make budgeting easier for investors relying on portfolio income to cover living expenses.

The ETF holds 50 stocks selected for both high yield and historically lower volatility. Top holdings include ConAgra Brands, Verizon, Altria Group, Pfizer, VICI Properties, and ONEOK Inc.

SPHD has also demonstrated a consistent payout history. It recently paid a dividend of just over 20 cents per share on April 24, following similar payouts in March and February. That consistency may appeal to investors seeking predictable income streams during uncertain economic conditions.

dividend etfs - StockEarnings

Vanguard Dividend Appreciation ETF Focuses on Long-Term Quality 


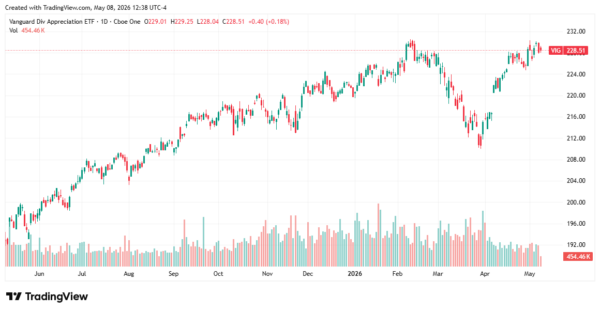
The Vanguard Dividend Appreciation ETF (NYSEARCA: VIG) takes a different approach by emphasizing long-term dividend growth instead of simply chasing higher yields. With an extremely low expense ratio of 0.05% and a yield of approximately 1.56%, VIG is designed for investors seeking quality and stability over time.

The ETF tracks the S&P U.S. Dividend Growers Index and invests in large-cap companies with strong histories of increasing dividends. Many of these businesses also benefit from durable competitive advantages and strong balance sheets.

Among VIG’s 338 holdings are Apple, Microsoft, Broadcom, JPMorgan, Eli Lilly, Visa, Exxon Mobil, UnitedHealth Group, Mastercard, and Costco Wholesale. These are companies with strong earnings power that can continue rewarding shareholders even during slower economic periods.

VIG pays a quarterly dividend and most recently distributed just over 83 cents per share on March 31 after paying more than 88 cents per share in December.

dividend etfs - StockEArnings

Dividend ETFs Can Help Investors Stay Calm During Volatility

Market volatility is never comfortable, but it doesn’t have to derail a long-term investment strategy. For income-focused investors, dividend ETFs can provide stability by delivering regular payouts while still offering exposure to quality companies with proven track records.

Funds like the SPDR S&P Dividend ETF, Invesco S&P 500 High Dividend Low Volatility ETF, and Vanguard Dividend Appreciation ETF each offer a different approach to generating income, whether through higher yields, lower volatility, or long-term dividend growth. While no investment is completely immune to market swings, owning diversified ETFs filled with financially strong companies can make it easier to stay invested during uncertain times. 

Over the last 26 years, he’s taught thousands of investors how to trade news flow and herd mentality using a unique blend of technical and fundamental analysis. Cooper was among the few analysts to spot the financial crisis of 2008, the top of subprime and Alt-A, the death of Lehman Brothers, Bear Stearns, and New Century Financial, and even the Dow’s collapse to 6,500, as well as its recovery. He even called for gold to rally well above $1.500 when it traded under $600. At the moment, Cooper makes use of technical, fundamental and news analysis, to help individual investors grow their wealth. He’s a firm believer that hard work and thorough research will lead to investment success.

Join over 1.2M+ investors/traders who receive daily and weekly notable earnings alerts with predicted move