ajax loader

Loading...


Ride-the-Wave Strategy – Best for Stock Traders

Ride-the-Wave targets multi-day price momentum following a company’s earnings announcement (EA). With this strategy:

  1. Buy a stock one day post-EA if a stock reacts positively post-earnings:
    1. Near the close of trading the EA-day for a pre-market-EA
    2. Near the close of the following day for a post-market-EA
  2. Sell-to-close after 7-10 days, or possibly earlier if a desired price target is reached

Similarly,

  1. short a stock one day post-EA if a stock reacts negatively post-earnings:
    1. near the close of trading the EA-day for a premarket-EA
    2. near the close of the following day for a post-market-EA
  2. then buy-to-close after 7-10 days, or possibly earlier if a desired price target is reached

Important: Ride-the-Wave is predicated on significant price momentum triggered by an EA. The 7-10 day scenario is the maximum trade hold-time. If you see post EA-momentum is halted or reversed by a significant opposite move, re-evaluate your presence in the trade.

This popular StockEarnings screen below will give you a list of stocks that historically exhibit significant price momentum following an EA for the next seven days:

  1. Stocks exhibiting positive post-EA price moves are buy-candidates
  2. Stocks exhibiting negative post-EA price moves are sell/short-candidates

The screen includes those stocks whose Earnings just came out in last two days.

Screen criteria:

  1. Earnings Date Start Date : Current Date + -1 Day
  2. Earnings Date End Date : Current Date + -2 Days
  3. Predicted Move (Next Day) Max : 7%
  4. Predicted Move (On 7th Day) Min : 7%

Strategy Guideline:

  1. Buy the stock if stock has reacted positively. Short the stock if stock has reacted negatively (see above).
  2. Close the position in 7-10 days, or possibly earlier based on price move.

Volatility Crush Strategy - Best for Options Traders

The Volatility Crush strategy is used with stocks that typically experience relatively low-to-moderate price moves (≤4%) following their Earnings Announcements (EA). The basic trade idea is to sell put or call options right before the EA, collecting a credit when options premium is very high due to elevated implied volatility (IV). You then close the position right after the EA by buying the option back much cheaper due to the significant drop in IV that occurs after the mystery of the EA disappears. In assessing this trade, you need to do your homework to ensure you collect sufficient premium to make the trade worthwhile.

This trade is practical due to the low-to-moderate price-move after the EA, which generally won’t significantly affect the options price, unlike an “action” stock, which experience great price moves post-EA. With these symbols, if you’re on the right side of the price move, that’s a great thing. But if you’re on the wrong side of the move, not so great. Consequently, by minimizing the effect of the post-EA price move, you have a much better chance to profit from the reduction in IV without it being ruined by a violent price move.

For this trade, open the position either (1) the night before the EA when the company announces earnings or (2) during the EA day when it announces post-market, generally capturing IV at or close to its peak.

For this trade, open the position either (1) the night before the EA when the company announces earnings or (2) during the EA day when it announces post-market, generally capturing IV at or close to its peak.

This popular stockearnings screen will give you a list of stocks which do not react more than 4% fpost-EA. It includes only those stocks whose earnings are releasing next day.

Screen criteria:

  1. Earnings Date Start Date : Current Date + 1
  2. Earnings Date End Date : Current Date + 1
  3. Predicted Move (Next Day) Max : 4%
  4. Options Type: Weekly

Strategy Guideline:

  1. Options Strategy: Sell Call and Put
  2. Options Strike Price: Current Stock Price – (% Predicated Move x 2)
  3. Expiration Date: It should generally be the closest expiry immediately after the EA.
  4. Buy Insurance: Buying back Call and Put at Strike price which 10% lower than Sell Strike Price is optional but recommended.

Watch Video for More Detail

Volatility Rush Strategy - Best for Options Traders

The Volatility Rush takes advantage of increasing options premiums into earnings announcements (EA) caused by an anticipated rise in Implied Volatility (IV). With this strategy, Buy a Call and Put at-the-money (a long straddle) 2-3 weeks before the EA when IV is lower. Sell the position either (1) the night before the EA when the company announces earnings pre-market, or (2) during the EA day when it announces post-market, generally capturing IV at or close to its peak.

This popular screen will give you a list of stocks whose Options premiums tend to rise into Earnings. It includes only those stocks whose Earnings are at least two weeks away from today.

Screen criteria:

  1. Earnings Date Start Date : Current Date + 15 Days
  2. Earnings Date End Date : Current Date + 30 Days
  3. Predicted Move (Next Day) Min : 5%
  4. Options Type: Weekly or Monthly if that lines up with the two to three-week lead-time for entering the trade

Strategy Guideline:

  1. Buy a Straddle at or close to the money two to three weeks pre-EA.
  2. Sell the position either the night before the EA when the company announces earnings pre-market, or during the EA day when it announces post-market.
  3. Expiration date should generally be the closest expiry immediately after the EA.
  4. Straddle price should not be more 60% of predicted move.

Predicted Move (Volatility)

Similar to Implied Volatility in Options. Expected volatility % based on our Proprietary Volatility Predication Model. We are expecting that stock price will likely to reach % in either direction by the end of next trading session after Earnings are released and not necessarily the closing volatility %.

Why is it important?

    This indicator helps

  1. Knowing expected volatility in stocks after Earnings helps to decide trading stocks before Earnings Announcement.
  2. Taking Advantage of volatility collapse following Earnings Results by using Advance Options strategies such as Spread and Straddles.

Since Last Earnings

Change in share price since last Earnings release.

Why is it Important?

When share has gained more than 10% since it's last Earning release, it tends to over react to minor bad news and give up some gains if not all. So, it contains more downside volatility than upside When share has dropped more than 10% since it's last Earning release, it tends to over react to minor good news and recover some drops if not all. So, it contains more upside volatility than downside.

EPS Surprise (%)

Occurs when a company's reported quarterly or annual profits are above or below analysts' expectations. Here is the formula to derive % EPS Surprice:

Actual EPS - Estimated EPS
------------------------------------- x 100
Estimated EPS

Why is it Important?

Earnings surprises can have a huge impact on a company's stock price. Several studies suggest that positive earnings surprises not only lead to an immediate hike in a stock's price, but also to a gradual increase over time. Hence, it's not surprising that some companies are known for routinely beating earning projections. A negative earnings surprise will usually result in a decline in share price.

Next Day Price Change (%)

Next Regular trading session Closing price following Earnings result.

For After Market Close Earnings, It is a next trading day closing price. For Before Market Open Earnings, It is the same trading day closing price.

Why is it Important?

Next Day price change is a reaction of Earnings result.

SpaceX Mania Is Creating a Buying Opportunity in Costco Stock

Posted on Jun 18, 2026 by Chris Markoch

SpaceX Mania Is Creating a Buying Opportunity in Costco Stock

When the most hyped IPO in stock market history hits, money has to come from somewhere. On June 12, SpaceX made its Nasdaq debut under the ticker SPCX, raising $75 billion in what became the largest IPO on record — and roughly $15 billion of that haul came directly from retail investors, an allocation described by Nasdaq President Nelson Griggs as “larger than most IPOs.”

That’s a staggering amount of cash that had to be liquidated from somewhere. One likely source: premium-priced holdings investors were sitting on — exactly the kind of stocks that look expensive on a spreadsheet but have proven themselves over decades. Costco Wholesale (NASDAQ: COST) fits that description perfectly.

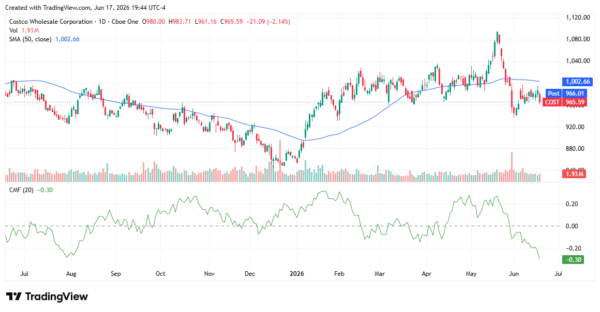
The chart tells the story. COST peaked near $1,096 in May before dropping sharply heading into the SpaceX IPO window. More telling than the price action is the Chaikin Money Flow (CMF) oscillator, which has plunged to -0.30, a reading that signals unusually heavy distribution. Shares are now trading around $965, sitting below their 50-day moving average of $1,002, and the selling pressure looks more institutional and situational than fundamental.

The word “overpriced” gets thrown at Costco regularly. Technically, it’s not wrong. But there’s a difference between a stock that’s expensive and a stock that’s a bad investment. Costco has spent 25 years proving it belongs in the former category. If the SpaceX frenzy is dragging COST lower, long-term investors may want to treat it as a gift.

The Consumer Is Spending — Costco Is Capturing It


The macro hand-wringing about consumer health is real. Credit card delinquencies are elevated. Lower-income households are stretched. Sentiment surveys are grim. And yet the actual spending data keeps coming in stronger than expected — and Costco keeps printing numbers that make the pessimists look wrong.

In its fiscal third quarter of 2026, Costco reported net sales of $69.15 billion, up 11.6% year over year, with comparable sales growing 9.8%. May’s monthly comparable sales then accelerated further to 12.5% growth, with total net sales reaching $24.01 billion — a 14.5% year-over-year increase.

The key insight here is that Costco doesn’t rely on the lower leg of what economists call the K-shaped economy. Its membership model — with worldwide renewal rates of 89.7% and U.S. and Canadian renewal rates at 92.2% — draws disproportionately from middle- and upper-income households. These are consumers who are still spending, still traveling, and still renewing their $65 or $130 memberships without a second thought.

In an environment where value perception matters more than ever, Costco’s proposition actually gets stronger. When consumers trade down from specialty grocers or department stores, they frequently trade sideways into Costco. The bulk-buy model becomes a feature, not just a habit. That’s a competitive moat that doesn’t show up cleanly in any single earnings line — but it shows up quarter after quarter.

The Dividend Nobody Talks About

Costco’s headline yield is easy to dismiss. The trailing twelve-month dividend payout stands at $5.20 per share, translating to a yield of roughly 0.52% at current prices. Against a 10-year Treasury, that looks laughable.

But that framing misses how Costco actually returns capital. The company paid a $12-per-share special dividend in January 2026 — a single payment totaling approximately $5.3 billion, continuing a tradition of extraordinary capital returns. That’s on top of the regular quarterly dividend, which has compounded at a growth rate of roughly 13% annually over the past five years.

The pattern is consistent: Costco uses its regular dividend for steady, predictable income growth, and then periodically drops a special dividend when the balance sheet allows. For investors who bought at lower prices and held, the special payout in early 2024 amounted to a one-time yield of 2.4% for shareholders who bought just before the announcement — more than double what the average S&P 500 company pays in two years. With the stock now pulling back toward the $960s, the yield-on-cost math for buyers at these levels looks incrementally better — and another special dividend remains well within Costco’s capital allocation playbook.

What the Chart Is Actually Saying

COST’s technical picture deserves more attention than a simple “it pulled back” summary. The stock recently made an all-time high above $1,096 in mid-May, then reversed sharply. That kind of move, from a 52-week high that coincides exactly with the SpaceX IPO window, is not coincidental.

The CMF oscillator, which tracks the flow of money into and out of a security over a rolling 20-day period, has collapsed to -0.30 — one of the deepest negative readings on the chart over the past year. Extreme CMF readings like this tend to resolve when the technical selling pressure exhausts itself, particularly when the underlying business hasn’t changed.

The 50-day SMA at $1,002 is now acting as overhead resistance, but a stock with Costco’s fundamental consistency doesn’t tend to stay far below that line for long. The selling here looks transactional, not a verdict on the business. Investors who can tolerate near-term volatility may see an attractive entry point.

costco - StockEarnings

The Stock Split Question

One piece of Costco mythology worth addressing: the idea that a stock split would be a meaningful catalyst. Costco’s management has publicly stated that a stock split is not a priority, citing the widespread availability of fractional share investing. The company’s last split occurred in January 2000, and management has historically cited deep institutional ownership as a reason splitting carries less economic necessity in today’s market.

With roughly 66% institutional ownership, that argument holds up. The investors who move COST don’t need psychological accessibility — they’re buying $50 million blocks at a time.

The contrarian take is that Costco might be wise to consider a split while it’s still a nice-to-do rather than a have-to-do. When a share price crosses $1,000 and dips back below it — as is happening right now — the narrative around accessibility starts to build on its own. The counterargument: with comps accelerating and the membership model intact, Costco doesn’t need a split to attract attention. The business is doing that just fine.

The Bottom Line

Costco isn’t a bargain in any traditional sense. At roughly 50x earnings, you’re paying a premium for one of the most durable retail franchises ever built. But the SpaceX IPO created a rare window where situational selling — not fundamental deterioration — has pushed shares meaningfully lower.

With year-to-date net sales up 9.6% through 36 weeks and the membership renewal engine running at near-record levels, nothing has changed about the underlying business. The question isn’t whether COST is cheap. It isn’t. The question is whether you want to own one of retail’s best long-term compounders at a price that wouldn’t exist without Elon Musk’s rocket company. For patient investors, the answer looks like yes.

A former marketing copywriter turned freelance financial writer and market analyst. I have a passion for delivering insights to investors. I write regularly about stocks for StockEarnings and MarketBeat. Posts are not advice.

Join over 1.2M+ investors/traders who receive daily and weekly notable earnings alerts with predicted move