ajax loader

Loading...


Ride-the-Wave Strategy – Best for Stock Traders

Ride-the-Wave targets multi-day price momentum following a company’s earnings announcement (EA). With this strategy:

  1. Buy a stock one day post-EA if a stock reacts positively post-earnings:
    1. Near the close of trading the EA-day for a pre-market-EA
    2. Near the close of the following day for a post-market-EA
  2. Sell-to-close after 7-10 days, or possibly earlier if a desired price target is reached

Similarly,

  1. short a stock one day post-EA if a stock reacts negatively post-earnings:
    1. near the close of trading the EA-day for a premarket-EA
    2. near the close of the following day for a post-market-EA
  2. then buy-to-close after 7-10 days, or possibly earlier if a desired price target is reached

Important: Ride-the-Wave is predicated on significant price momentum triggered by an EA. The 7-10 day scenario is the maximum trade hold-time. If you see post EA-momentum is halted or reversed by a significant opposite move, re-evaluate your presence in the trade.

This popular StockEarnings screen below will give you a list of stocks that historically exhibit significant price momentum following an EA for the next seven days:

  1. Stocks exhibiting positive post-EA price moves are buy-candidates
  2. Stocks exhibiting negative post-EA price moves are sell/short-candidates

The screen includes those stocks whose Earnings just came out in last two days.

Screen criteria:

  1. Earnings Date Start Date : Current Date + -1 Day
  2. Earnings Date End Date : Current Date + -2 Days
  3. Predicted Move (Next Day) Max : 7%
  4. Predicted Move (On 7th Day) Min : 7%

Strategy Guideline:

  1. Buy the stock if stock has reacted positively. Short the stock if stock has reacted negatively (see above).
  2. Close the position in 7-10 days, or possibly earlier based on price move.

Volatility Crush Strategy - Best for Options Traders

The Volatility Crush strategy is used with stocks that typically experience relatively low-to-moderate price moves (≤4%) following their Earnings Announcements (EA). The basic trade idea is to sell put or call options right before the EA, collecting a credit when options premium is very high due to elevated implied volatility (IV). You then close the position right after the EA by buying the option back much cheaper due to the significant drop in IV that occurs after the mystery of the EA disappears. In assessing this trade, you need to do your homework to ensure you collect sufficient premium to make the trade worthwhile.

This trade is practical due to the low-to-moderate price-move after the EA, which generally won’t significantly affect the options price, unlike an “action” stock, which experience great price moves post-EA. With these symbols, if you’re on the right side of the price move, that’s a great thing. But if you’re on the wrong side of the move, not so great. Consequently, by minimizing the effect of the post-EA price move, you have a much better chance to profit from the reduction in IV without it being ruined by a violent price move.

For this trade, open the position either (1) the night before the EA when the company announces earnings or (2) during the EA day when it announces post-market, generally capturing IV at or close to its peak.

For this trade, open the position either (1) the night before the EA when the company announces earnings or (2) during the EA day when it announces post-market, generally capturing IV at or close to its peak.

This popular stockearnings screen will give you a list of stocks which do not react more than 4% fpost-EA. It includes only those stocks whose earnings are releasing next day.

Screen criteria:

  1. Earnings Date Start Date : Current Date + 1
  2. Earnings Date End Date : Current Date + 1
  3. Predicted Move (Next Day) Max : 4%
  4. Options Type: Weekly

Strategy Guideline:

  1. Options Strategy: Sell Call and Put
  2. Options Strike Price: Current Stock Price – (% Predicated Move x 2)
  3. Expiration Date: It should generally be the closest expiry immediately after the EA.
  4. Buy Insurance: Buying back Call and Put at Strike price which 10% lower than Sell Strike Price is optional but recommended.

Watch Video for More Detail

Volatility Rush Strategy - Best for Options Traders

The Volatility Rush takes advantage of increasing options premiums into earnings announcements (EA) caused by an anticipated rise in Implied Volatility (IV). With this strategy, Buy a Call and Put at-the-money (a long straddle) 2-3 weeks before the EA when IV is lower. Sell the position either (1) the night before the EA when the company announces earnings pre-market, or (2) during the EA day when it announces post-market, generally capturing IV at or close to its peak.

This popular screen will give you a list of stocks whose Options premiums tend to rise into Earnings. It includes only those stocks whose Earnings are at least two weeks away from today.

Screen criteria:

  1. Earnings Date Start Date : Current Date + 15 Days
  2. Earnings Date End Date : Current Date + 30 Days
  3. Predicted Move (Next Day) Min : 5%
  4. Options Type: Weekly or Monthly if that lines up with the two to three-week lead-time for entering the trade

Strategy Guideline:

  1. Buy a Straddle at or close to the money two to three weeks pre-EA.
  2. Sell the position either the night before the EA when the company announces earnings pre-market, or during the EA day when it announces post-market.
  3. Expiration date should generally be the closest expiry immediately after the EA.
  4. Straddle price should not be more 60% of predicted move.

Predicted Move (Volatility)

Similar to Implied Volatility in Options. Expected volatility % based on our Proprietary Volatility Predication Model. We are expecting that stock price will likely to reach % in either direction by the end of next trading session after Earnings are released and not necessarily the closing volatility %.

Why is it important?

    This indicator helps

  1. Knowing expected volatility in stocks after Earnings helps to decide trading stocks before Earnings Announcement.
  2. Taking Advantage of volatility collapse following Earnings Results by using Advance Options strategies such as Spread and Straddles.

Since Last Earnings

Change in share price since last Earnings release.

Why is it Important?

When share has gained more than 10% since it's last Earning release, it tends to over react to minor bad news and give up some gains if not all. So, it contains more downside volatility than upside When share has dropped more than 10% since it's last Earning release, it tends to over react to minor good news and recover some drops if not all. So, it contains more upside volatility than downside.

EPS Surprise (%)

Occurs when a company's reported quarterly or annual profits are above or below analysts' expectations. Here is the formula to derive % EPS Surprice:

Actual EPS - Estimated EPS
------------------------------------- x 100
Estimated EPS

Why is it Important?

Earnings surprises can have a huge impact on a company's stock price. Several studies suggest that positive earnings surprises not only lead to an immediate hike in a stock's price, but also to a gradual increase over time. Hence, it's not surprising that some companies are known for routinely beating earning projections. A negative earnings surprise will usually result in a decline in share price.

Next Day Price Change (%)

Next Regular trading session Closing price following Earnings result.

For After Market Close Earnings, It is a next trading day closing price. For Before Market Open Earnings, It is the same trading day closing price.

Why is it Important?

Next Day price change is a reaction of Earnings result.

Beyond Big Tech: 3 Stocks for Investors Seeking True Diversification

Posted on Jun 18, 2026 by Grayson Cavern

Beyond Big Tech: 3 Stocks for Investors Seeking True Diversification

Wall Street has a funny way of convincing investors they’re diversified. A semiconductor fund owns artificial intelligence stocks, a technology ETF owns artificial intelligence stocks, and a growth portfolio owns artificial intelligence stocks.

Now, there is nothing wrong with betting on a winning theme. The problem begins when investors mistake exposure for diversification and gradually commit larger portions of their capital to businesses whose fortunes ultimately depend on the same outcome, because twenty stocks spread across five different funds provide very little protection when the same economic force is driving them all.

This is why I’ve identified 3 different companies, whose revenue drivers originate long before AI arrived and will remain long after Wall Street discovers its next obsession.

Arthur J. Gallagher: The Business Of Managing Risk


The modern economy runs on expansion. Companies hire employees, enter new markets, acquire competitors, launch products, and build facilities that create a growing web of liabilities and exposures that become complex as businesses grow larger. Somebody has to help organizations navigate that complexity. That’s the role Arthur J. Gallagher (NYSE: AJG) has spent decades building.

The insurance brokerage giant delivered another strong quarter, with revenue before reimbursements climbing to $4.72 billion from $3.69 billion a year ago while net earnings increased to $823 million from $709 million. Diluted earnings per share rose to $3.16 from $2.72, supported by both acquisitions and steady organic growth.

Gallagher also generated 5% organic revenue growth while expanding adjusted EBITDAC to $1.75 billion from $1.44 billion, demonstrating that demand continues growing alongside economic activity rather than depending on a specific trend or technology cycle. Management also repurchased roughly 1.4 million shares during the quarter for approximately $310 million, continuing a disciplined approach to capital allocation.

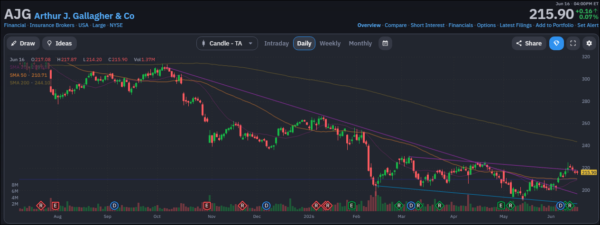
It trades around $215.90 after reclaiming both the 20-day moving average near $209 and the 50-day moving average near $211. Volume accelerated during the June breakout while the stock continued carving out higher lows after several months of consolidation. The 200-day moving average sits near $244, leaving a meaningful gap between today’s price and a level many institutions use to define longer-term trend strength.

Diversification-StocksEarnings

Waste Management: A Toll Booth On Economic Activity

While most businesses need customers, Waste Management (NYSE: WM) just needs the economy to keep moving. Because when products move through supply chains, retailers stock shelves, hospitals treat patients, manufacturers produce goods, restaurants serve meals, and distribution centers ship packages across the country… It creates a continuous flow of material that ends up passing through collection routes, transfer stations, recycling facilities, renewable energy projects, and landfill infrastructure.

Few companies sit closer to that process than Waste Management.

The company generated $6.23 billion in first-quarter revenue compared to $6.02 billion a year earlier while net income climbed to $723 million from $637 million. Adjusted operating EBITDA reached $1.85 billion, and free cash flow nearly doubled to $920 million from $475 million.

The business itself continues evolving. Renewable energy revenue surged to $159 million from $91 million, while recently completed recycling facilities added nearly 300,000 tons of annual processing capacity. Those investments are steadily transforming Waste Management from a traditional waste collection company into a broader environmental infrastructure business capable of generating growth from multiple sources.

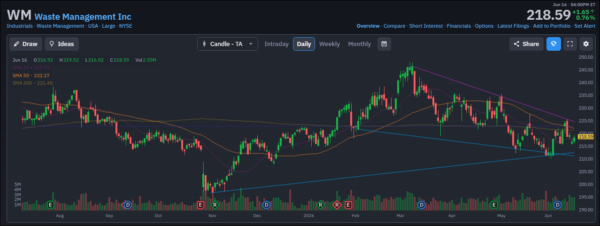
The stock traded around $218.59 after defending support near $210 and pushing back toward its 20-day moving average near $219. Trading volume strengthened during the rebound while the 200-day moving average sits near $221, placing shares within reach of a technical level that often attracts institutional buyers.

Diversification-StocksEarnings

Copart: The Market Leader Hiding In Plain Sight

Copart (NASDAQ: CPRT) benefits from a reality most investors never think about until they need it: damaged vehicles don’t disappear.

They must be transported, stored, auctioned, dismantled, exported, repaired, or recycled, creating an ecosystem that insurance companies rely on regardless of where the economy sits in the cycle. The company has quietly built the world’s largest online salvage vehicle marketplace around that process, connecting insurers, fleet operators, dismantlers, dealers, exporters, and buyers across more than 185 countries.

Its latest quarter highlighted the durability of that model. Revenue increased to $1.24 billion while gross profit climbed to $572.6 million. Diluted earnings per share rose to $0.43 from $0.42, and profitability remained strong despite broader economic uncertainty. Copart ended the quarter with $3.35 billion in cash, cash equivalents, and restricted cash while carrying total liabilities of just $857.6 million. Very few companies possess that level of financial flexibility, particularly at a time when many businesses continue depending on debt markets to fund expansion.

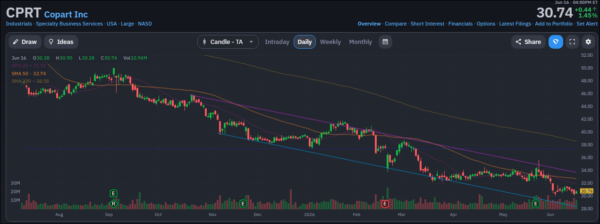
The chart remains the weakest of the three names, which is exactly why it deserves a closer look. Shares recently traded around $30.74 while remaining below the 20-day moving average of $31.91, the 50-day moving average of $32.74, and the 200-day moving average of $38.58. Yet buyers continue defending the $29 to $30 range, and volume has expanded during recent rebounds from those levels, suggesting demand continues emerging despite the broader downtrend.

Diversification-StocksEarnings

Diversification Means Owning Different Outcomes

Artificial intelligence may continue driving markets higher. Data-center spending may keep expanding. Semiconductor companies may continue delivering exceptional growth.

None of those possibilities conflict with the idea of diversification.

My point is that the strongest portfolios are built around businesses benefiting from different economic forces rather than different versions of the same theme. So when capital starts looking beyond today’s favorite theme, investors already positioned in businesses powered by different outcomes would still retain their edges regardless of the situation.

Join over 1.2M+ investors/traders who receive daily and weekly notable earnings alerts with predicted move