ajax loader

Loading...


Ride-the-Wave Strategy – Best for Stock Traders

Ride-the-Wave targets multi-day price momentum following a company’s earnings announcement (EA). With this strategy:

  1. Buy a stock one day post-EA if a stock reacts positively post-earnings:
    1. Near the close of trading the EA-day for a pre-market-EA
    2. Near the close of the following day for a post-market-EA
  2. Sell-to-close after 7-10 days, or possibly earlier if a desired price target is reached

Similarly,

  1. short a stock one day post-EA if a stock reacts negatively post-earnings:
    1. near the close of trading the EA-day for a premarket-EA
    2. near the close of the following day for a post-market-EA
  2. then buy-to-close after 7-10 days, or possibly earlier if a desired price target is reached

Important: Ride-the-Wave is predicated on significant price momentum triggered by an EA. The 7-10 day scenario is the maximum trade hold-time. If you see post EA-momentum is halted or reversed by a significant opposite move, re-evaluate your presence in the trade.

This popular StockEarnings screen below will give you a list of stocks that historically exhibit significant price momentum following an EA for the next seven days:

  1. Stocks exhibiting positive post-EA price moves are buy-candidates
  2. Stocks exhibiting negative post-EA price moves are sell/short-candidates

The screen includes those stocks whose Earnings just came out in last two days.

Screen criteria:

  1. Earnings Date Start Date : Current Date + -1 Day
  2. Earnings Date End Date : Current Date + -2 Days
  3. Predicted Move (Next Day) Max : 7%
  4. Predicted Move (On 7th Day) Min : 7%

Strategy Guideline:

  1. Buy the stock if stock has reacted positively. Short the stock if stock has reacted negatively (see above).
  2. Close the position in 7-10 days, or possibly earlier based on price move.

Volatility Crush Strategy - Best for Options Traders

The Volatility Crush strategy is used with stocks that typically experience relatively low-to-moderate price moves (≤4%) following their Earnings Announcements (EA). The basic trade idea is to sell put or call options right before the EA, collecting a credit when options premium is very high due to elevated implied volatility (IV). You then close the position right after the EA by buying the option back much cheaper due to the significant drop in IV that occurs after the mystery of the EA disappears. In assessing this trade, you need to do your homework to ensure you collect sufficient premium to make the trade worthwhile.

This trade is practical due to the low-to-moderate price-move after the EA, which generally won’t significantly affect the options price, unlike an “action” stock, which experience great price moves post-EA. With these symbols, if you’re on the right side of the price move, that’s a great thing. But if you’re on the wrong side of the move, not so great. Consequently, by minimizing the effect of the post-EA price move, you have a much better chance to profit from the reduction in IV without it being ruined by a violent price move.

For this trade, open the position either (1) the night before the EA when the company announces earnings or (2) during the EA day when it announces post-market, generally capturing IV at or close to its peak.

For this trade, open the position either (1) the night before the EA when the company announces earnings or (2) during the EA day when it announces post-market, generally capturing IV at or close to its peak.

This popular stockearnings screen will give you a list of stocks which do not react more than 4% fpost-EA. It includes only those stocks whose earnings are releasing next day.

Screen criteria:

  1. Earnings Date Start Date : Current Date + 1
  2. Earnings Date End Date : Current Date + 1
  3. Predicted Move (Next Day) Max : 4%
  4. Options Type: Weekly

Strategy Guideline:

  1. Options Strategy: Sell Call and Put
  2. Options Strike Price: Current Stock Price – (% Predicated Move x 2)
  3. Expiration Date: It should generally be the closest expiry immediately after the EA.
  4. Buy Insurance: Buying back Call and Put at Strike price which 10% lower than Sell Strike Price is optional but recommended.

Watch Video for More Detail

Volatility Rush Strategy - Best for Options Traders

The Volatility Rush takes advantage of increasing options premiums into earnings announcements (EA) caused by an anticipated rise in Implied Volatility (IV). With this strategy, Buy a Call and Put at-the-money (a long straddle) 2-3 weeks before the EA when IV is lower. Sell the position either (1) the night before the EA when the company announces earnings pre-market, or (2) during the EA day when it announces post-market, generally capturing IV at or close to its peak.

This popular screen will give you a list of stocks whose Options premiums tend to rise into Earnings. It includes only those stocks whose Earnings are at least two weeks away from today.

Screen criteria:

  1. Earnings Date Start Date : Current Date + 15 Days
  2. Earnings Date End Date : Current Date + 30 Days
  3. Predicted Move (Next Day) Min : 5%
  4. Options Type: Weekly or Monthly if that lines up with the two to three-week lead-time for entering the trade

Strategy Guideline:

  1. Buy a Straddle at or close to the money two to three weeks pre-EA.
  2. Sell the position either the night before the EA when the company announces earnings pre-market, or during the EA day when it announces post-market.
  3. Expiration date should generally be the closest expiry immediately after the EA.
  4. Straddle price should not be more 60% of predicted move.

Predicted Move (Volatility)

Similar to Implied Volatility in Options. Expected volatility % based on our Proprietary Volatility Predication Model. We are expecting that stock price will likely to reach % in either direction by the end of next trading session after Earnings are released and not necessarily the closing volatility %.

Why is it important?

    This indicator helps

  1. Knowing expected volatility in stocks after Earnings helps to decide trading stocks before Earnings Announcement.
  2. Taking Advantage of volatility collapse following Earnings Results by using Advance Options strategies such as Spread and Straddles.

Since Last Earnings

Change in share price since last Earnings release.

Why is it Important?

When share has gained more than 10% since it's last Earning release, it tends to over react to minor bad news and give up some gains if not all. So, it contains more downside volatility than upside When share has dropped more than 10% since it's last Earning release, it tends to over react to minor good news and recover some drops if not all. So, it contains more upside volatility than downside.

EPS Surprise (%)

Occurs when a company's reported quarterly or annual profits are above or below analysts' expectations. Here is the formula to derive % EPS Surprice:

Actual EPS - Estimated EPS
------------------------------------- x 100
Estimated EPS

Why is it Important?

Earnings surprises can have a huge impact on a company's stock price. Several studies suggest that positive earnings surprises not only lead to an immediate hike in a stock's price, but also to a gradual increase over time. Hence, it's not surprising that some companies are known for routinely beating earning projections. A negative earnings surprise will usually result in a decline in share price.

Next Day Price Change (%)

Next Regular trading session Closing price following Earnings result.

For After Market Close Earnings, It is a next trading day closing price. For Before Market Open Earnings, It is the same trading day closing price.

Why is it Important?

Next Day price change is a reaction of Earnings result.

Missed SpaceX? Here Are 3 Public Stocks Riding The Same Trend

Posted on Jun 19, 2026 by Grayson Cavern

Missed SpaceX? Here Are 3 Public Stocks Riding The Same Trend

SpaceX dominates the headlines, but the forces behind its growth extend well beyond one company. Right now, governments are pouring billions into next-generation defense systems. Telecoms are racing to eliminate connectivity dead zones. And demand for satellite communications keeps accelerating as commercial ambition and national security priorities converge on the same problem at the same time.

But investors who missed SpaceX’s run may have another way in, not through the rocket company itself, but through the businesses building the networks, supplying the hardware, and preparing governments for a future where access to space stops being optional. 

Here are 3 stocks worth looking into.

AST SpaceMobile Is Trying To Turn Space Into A Cell Tower


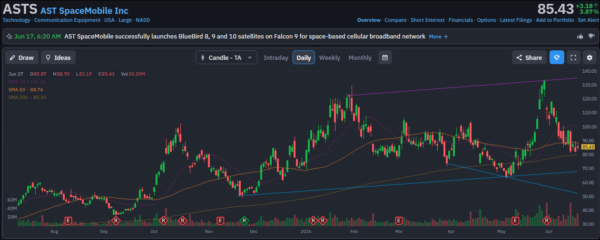
While most companies are promising connectivity, AST SpaceMobile (NASDAQ: ASTS)  is pursuing something far more ambitious: allowing ordinary smartphones to connect directly to satellites without specialized hardware 

Its first-quarter update showed a business moving from concept toward commercialization. Management is targeting approximately 45 BlueBird satellites in orbit by the end of 2026 while continuing to expand agreements with telecom partners around the world. The company now works with nearly 60 mobile network operators covering more than 3 billion subscribers and expects full-year revenue between $150 million and $200 million. It also finished the quarter with roughly $3.5 billion in cash, giving it one of the strongest balance sheets among emerging space companies.

AST also achieved peak download speeds of 98.9 Mbps directly to an unmodified smartphone and continues scaling production, with BlueBird satellites already in advanced stages of assembly. 

No wonder why the stock exploded to roughly $130 earlier this year before retreating toward the mid-$80s. The stock now sits below its 20-day and 50-day moving averages while remaining above its 200-day trend line. Volume surged during the recent pullback, suggesting investors are reassessing timelines rather than abandoning the story altogether.

For AST, the conversation has moved past whether direct-to-device connectivity works to how quickly management can convert technological leadership into meaningful revenue.

space-StockEarnings

Kratos Is Building The Defense Infrastructure 

Kratos Defense And Security Solutions Inc (NASDAQ: KTOS) sits at the intersection of space and defense budgets. The company develops systems supporting satellites, missile defense programs, hypersonic initiatives, drones, propulsion systems, and military communications. While investors often focus on launches and satellites, governments increasingly care about the infrastructure supporting them.

First-quarter results showed demand accelerating across the business. Revenue rose 22.6% to $371 million while organic growth reached 15.8%. Bookings totaled $605 million, producing a book-to-bill ratio of 1.6 and helping backlog climb to more than $2 billion. Management subsequently raised full-year guidance, citing what it described as a generational recapitalization of the U.S. defense industrial base. Those numbers suggest current growth is not coming from a single contract or isolated program. Demand is broadening across multiple areas tied to national security spending.

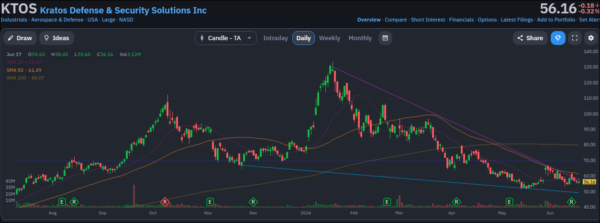
Not surprisingly, the chart tells a completely different story.

Shares have fallen from about $130 earlier this year to the mid-$50s and remain below their 20-day, 50-day, and 200-day moving averages. The long-term downtrend remains intact, and buyers have repeatedly failed to establish sustained momentum. At the same time, that disconnect reveals that Wall Street is focused on recent price weakness while management is talking about expanding budgets, rising backlog, and increasing demand across several strategic programs. If those trends continue, fundamentals may eventually force investors to revisit the stock.

space-StockEarnings

Karman Holdings May Be The Most Overlooked Name On This List

Unlike AST or Kratos, Karman Holdings Inc (NYSE: KRMN) remains largely unknown outside aerospace circles. But I suspect that may not last. The company supplies critical systems used across strategic missile defense, launch vehicles, tactical missile programs, and other national security applications. In other words, Karman benefits from growing demand for access to space without depending on consumer-facing excitement.

Its first-quarter results were also difficult to ignore as revenue jumped 51% year over year to $151.2 million. Adjusted EBITDA increased 47% to $44.8 million. Backlog reached approximately $1.6 billion, and management raised full-year revenue guidance to between $720 million and $735 million while increasing EBITDA expectations to as much as $215 million.

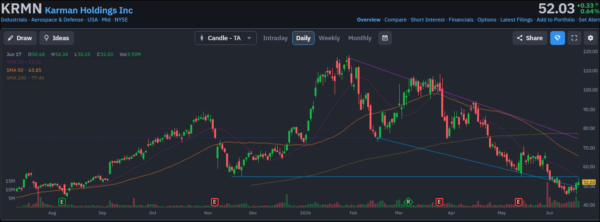
Those are the numbers investors typically associate with a stock making new highs. Instead, Karman shares have collapsed from around $115 earlier this year to roughly $52.

The chart shows a stock trading beneath every major moving average after months of sustained selling pressure. Yet recent price action suggests sellers may be losing control. Shares have started stabilizing near support around the low-$50 range even as the underlying business continues producing record revenue and record earnings.

As you probably know, sometimes the market gets ahead of fundamentals. Sometimes fundamentals catch up.

So before investors eventually decide whether a company growing revenue by more than 50% deserves to trade like a business in decline, grabbing some shares now could put me ahead of the curve.

space-StockEarnings

The Trend Is Bigger Than Any Single Company

SpaceX helped investors recognize the opportunity. But the next chapter may belong to the companies building the networks, infrastructure, and systems surrounding it. As you’ve already seen – AST SpaceMobile, Kratos,and Karman – sit at the centre of it all.

Join over 1.2M+ investors/traders who receive daily and weekly notable earnings alerts with predicted move