ajax loader

Loading...


Ride-the-Wave Strategy – Best for Stock Traders

Ride-the-Wave targets multi-day price momentum following a company’s earnings announcement (EA). With this strategy:

  1. Buy a stock one day post-EA if a stock reacts positively post-earnings:
    1. Near the close of trading the EA-day for a pre-market-EA
    2. Near the close of the following day for a post-market-EA
  2. Sell-to-close after 7-10 days, or possibly earlier if a desired price target is reached

Similarly,

  1. short a stock one day post-EA if a stock reacts negatively post-earnings:
    1. near the close of trading the EA-day for a premarket-EA
    2. near the close of the following day for a post-market-EA
  2. then buy-to-close after 7-10 days, or possibly earlier if a desired price target is reached

Important: Ride-the-Wave is predicated on significant price momentum triggered by an EA. The 7-10 day scenario is the maximum trade hold-time. If you see post EA-momentum is halted or reversed by a significant opposite move, re-evaluate your presence in the trade.

This popular StockEarnings screen below will give you a list of stocks that historically exhibit significant price momentum following an EA for the next seven days:

  1. Stocks exhibiting positive post-EA price moves are buy-candidates
  2. Stocks exhibiting negative post-EA price moves are sell/short-candidates

The screen includes those stocks whose Earnings just came out in last two days.

Screen criteria:

  1. Earnings Date Start Date : Current Date + -1 Day
  2. Earnings Date End Date : Current Date + -2 Days
  3. Predicted Move (Next Day) Max : 7%
  4. Predicted Move (On 7th Day) Min : 7%

Strategy Guideline:

  1. Buy the stock if stock has reacted positively. Short the stock if stock has reacted negatively (see above).
  2. Close the position in 7-10 days, or possibly earlier based on price move.

Volatility Crush Strategy - Best for Options Traders

The Volatility Crush strategy is used with stocks that typically experience relatively low-to-moderate price moves (≤4%) following their Earnings Announcements (EA). The basic trade idea is to sell put or call options right before the EA, collecting a credit when options premium is very high due to elevated implied volatility (IV). You then close the position right after the EA by buying the option back much cheaper due to the significant drop in IV that occurs after the mystery of the EA disappears. In assessing this trade, you need to do your homework to ensure you collect sufficient premium to make the trade worthwhile.

This trade is practical due to the low-to-moderate price-move after the EA, which generally won’t significantly affect the options price, unlike an “action” stock, which experience great price moves post-EA. With these symbols, if you’re on the right side of the price move, that’s a great thing. But if you’re on the wrong side of the move, not so great. Consequently, by minimizing the effect of the post-EA price move, you have a much better chance to profit from the reduction in IV without it being ruined by a violent price move.

For this trade, open the position either (1) the night before the EA when the company announces earnings or (2) during the EA day when it announces post-market, generally capturing IV at or close to its peak.

For this trade, open the position either (1) the night before the EA when the company announces earnings or (2) during the EA day when it announces post-market, generally capturing IV at or close to its peak.

This popular stockearnings screen will give you a list of stocks which do not react more than 4% fpost-EA. It includes only those stocks whose earnings are releasing next day.

Screen criteria:

  1. Earnings Date Start Date : Current Date + 1
  2. Earnings Date End Date : Current Date + 1
  3. Predicted Move (Next Day) Max : 4%
  4. Options Type: Weekly

Strategy Guideline:

  1. Options Strategy: Sell Call and Put
  2. Options Strike Price: Current Stock Price – (% Predicated Move x 2)
  3. Expiration Date: It should generally be the closest expiry immediately after the EA.
  4. Buy Insurance: Buying back Call and Put at Strike price which 10% lower than Sell Strike Price is optional but recommended.

Watch Video for More Detail

Volatility Rush Strategy - Best for Options Traders

The Volatility Rush takes advantage of increasing options premiums into earnings announcements (EA) caused by an anticipated rise in Implied Volatility (IV). With this strategy, Buy a Call and Put at-the-money (a long straddle) 2-3 weeks before the EA when IV is lower. Sell the position either (1) the night before the EA when the company announces earnings pre-market, or (2) during the EA day when it announces post-market, generally capturing IV at or close to its peak.

This popular screen will give you a list of stocks whose Options premiums tend to rise into Earnings. It includes only those stocks whose Earnings are at least two weeks away from today.

Screen criteria:

  1. Earnings Date Start Date : Current Date + 15 Days
  2. Earnings Date End Date : Current Date + 30 Days
  3. Predicted Move (Next Day) Min : 5%
  4. Options Type: Weekly or Monthly if that lines up with the two to three-week lead-time for entering the trade

Strategy Guideline:

  1. Buy a Straddle at or close to the money two to three weeks pre-EA.
  2. Sell the position either the night before the EA when the company announces earnings pre-market, or during the EA day when it announces post-market.
  3. Expiration date should generally be the closest expiry immediately after the EA.
  4. Straddle price should not be more 60% of predicted move.

Predicted Move (Volatility)

Similar to Implied Volatility in Options. Expected volatility % based on our Proprietary Volatility Predication Model. We are expecting that stock price will likely to reach % in either direction by the end of next trading session after Earnings are released and not necessarily the closing volatility %.

Why is it important?

    This indicator helps

  1. Knowing expected volatility in stocks after Earnings helps to decide trading stocks before Earnings Announcement.
  2. Taking Advantage of volatility collapse following Earnings Results by using Advance Options strategies such as Spread and Straddles.

Since Last Earnings

Change in share price since last Earnings release.

Why is it Important?

When share has gained more than 10% since it's last Earning release, it tends to over react to minor bad news and give up some gains if not all. So, it contains more downside volatility than upside When share has dropped more than 10% since it's last Earning release, it tends to over react to minor good news and recover some drops if not all. So, it contains more upside volatility than downside.

EPS Surprise (%)

Occurs when a company's reported quarterly or annual profits are above or below analysts' expectations. Here is the formula to derive % EPS Surprice:

Actual EPS - Estimated EPS
------------------------------------- x 100
Estimated EPS

Why is it Important?

Earnings surprises can have a huge impact on a company's stock price. Several studies suggest that positive earnings surprises not only lead to an immediate hike in a stock's price, but also to a gradual increase over time. Hence, it's not surprising that some companies are known for routinely beating earning projections. A negative earnings surprise will usually result in a decline in share price.

Next Day Price Change (%)

Next Regular trading session Closing price following Earnings result.

For After Market Close Earnings, It is a next trading day closing price. For Before Market Open Earnings, It is the same trading day closing price.

Why is it Important?

Next Day price change is a reaction of Earnings result.

How Investors are Safely Tapping into the AI Boom

Posted on Jun 19, 2026 by Ian Cooper

How Investors are Safely Tapping into the AI Boom

The AI boom is rapidly reshaping global markets, driving unprecedented growth across industries from healthcare and finance to cloud computing and robotics. With the AI sector projected to expand from roughly $137 billion in 2022 to more than $1.8 trillion by 2030, according to Grand View Research, investors are looking for ways to gain exposure.

Research highlighted by the Marketing AI Institute and Accenture suggests AI could lift global profitability by as much as 38%, contributing an estimated $14 trillion in additional economic value by 2035. Even MIT Technology Review has noted the accelerating pace of AI development, emphasizing its potential to transform nearly every aspect of the global economy over the coming decades.

Of course, you can always invest in heavyweights like Nvidia and Advanced Micro Devices. However, for those looking for a more diversified investment, AI-focused exchange-traded funds (ETFs) offer a safe alternative. 

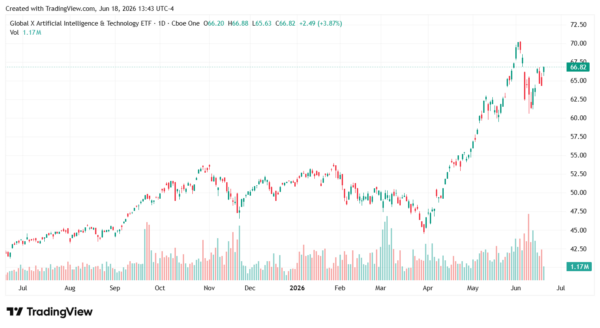
A Diversified AI and Technology ETF


For investors seeking diversified exposure to artificial intelligence, the Global X Artificial Intelligence & Technology ETF (AIQ) is one of the most widely followed options. With an expense ratio of 0.68%, the fund targets companies positioned to benefit from the growth and adoption of AI technologies across industries.

Its holdings include major technology leaders such as Palantir, Oracle, Broadcom, Netflix, Nvidia, Microsoft, and Meta Platforms, among others, spread across more than 80 total positions. This diversified structure allows investors to participate in AI growth while reducing reliance on any single company.

After pulling back earlier in the year, AIQ has rebounded strongly, moving from roughly $45 in April to around $66. Looking ahead, continued momentum in AI adoption could support a potential move toward the $80 level if broader market conditions remain favorable.

AI boom-StockEarnings

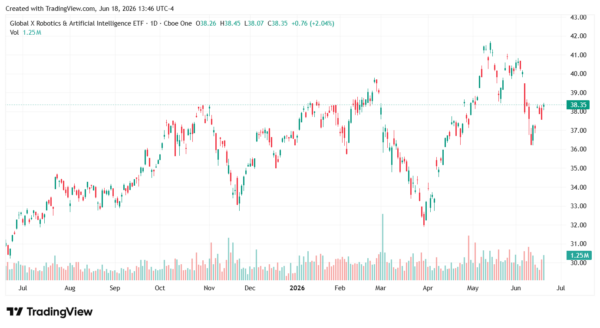
A Robotics-Focused AI ETF

Another popular option is the Global X Robotics and Artificial Intelligence ETF (BOTZ), which focuses more heavily on robotics alongside AI-driven innovation. With the same 0.68% expense ratio, BOTZ invests in companies benefiting from automation, machine learning, and advanced robotics systems.

Top holdings include Nvidia, Keyence, Dynatrace, SMC Corporation, Intuitive Surgical, Upstart Holdings, and C3.ai, among others. The fund’s narrower focus on industrial automation and robotics gives it a slightly different risk and growth profile compared to broader AI ETFs.

After bottoming near $24 in April, BOTZ has climbed to approximately $38.55. If momentum continues in the sector, we’d like to see it rally to at least $50 near term.

AI boom-StockEarnings

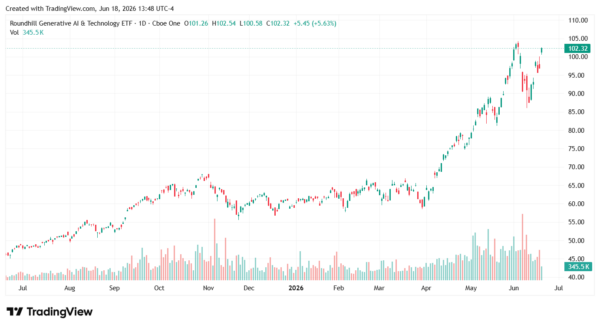
A Pure Play on the Generative AI Boom

The Roundhill Generative AI & Technology ETF (CHAT) focuses on companies driving the generative AI wave. With an expense ratio of 0.75%, it holds a concentrated portfolio of leaders shaping next-generation AI applications. Its holdings include Nvidia, Alphabet, Meta Platforms, Microsoft, Oracle, Palantir Technologies, and Alibaba Group, reflecting a mix of U.S. and global technology giants at the forefront of AI development.

Since dipping to around $60 in March, CHAT has staged a strong recovery and is now trading near $101.95. If enthusiasm around generative AI remains strong, a continued push toward the $110 level could be possible in the near term.

AI boom-StockEarnings

The Bigger Picture Behind the AI Boom

The AI boom is driving massive growth across global markets, and ETFs like AIQ, BOTZ, and CHAT offer diversified ways to invest in the trend, offering diversified exposure to companies building the infrastructure, applications, and breakthroughs powering the next wave of innovation.

For investors, the real opportunity may not be in trying to pick the single biggest winner in AI, but in maintaining broad exposure to a sector that is still in the early stages of its long-term growth cycle. As adoption accelerates across industries, staying invested in the AI theme—rather than timing it—may ultimately prove to be the more durable strategy.

Over the last 26 years, he’s taught thousands of investors how to trade news flow and herd mentality using a unique blend of technical and fundamental analysis. Cooper was among the few analysts to spot the financial crisis of 2008, the top of subprime and Alt-A, the death of Lehman Brothers, Bear Stearns, and New Century Financial, and even the Dow’s collapse to 6,500, as well as its recovery. He even called for gold to rally well above $1.500 when it traded under $600. At the moment, Cooper makes use of technical, fundamental and news analysis, to help individual investors grow their wealth. He’s a firm believer that hard work and thorough research will lead to investment success.

Join over 1.2M+ investors/traders who receive daily and weekly notable earnings alerts with predicted move