ajax loader

Loading...


Ride-the-Wave Strategy – Best for Stock Traders

Ride-the-Wave targets multi-day price momentum following a company’s earnings announcement (EA). With this strategy:

  1. Buy a stock one day post-EA if a stock reacts positively post-earnings:
    1. Near the close of trading the EA-day for a pre-market-EA
    2. Near the close of the following day for a post-market-EA
  2. Sell-to-close after 7-10 days, or possibly earlier if a desired price target is reached

Similarly,

  1. short a stock one day post-EA if a stock reacts negatively post-earnings:
    1. near the close of trading the EA-day for a premarket-EA
    2. near the close of the following day for a post-market-EA
  2. then buy-to-close after 7-10 days, or possibly earlier if a desired price target is reached

Important: Ride-the-Wave is predicated on significant price momentum triggered by an EA. The 7-10 day scenario is the maximum trade hold-time. If you see post EA-momentum is halted or reversed by a significant opposite move, re-evaluate your presence in the trade.

This popular StockEarnings screen below will give you a list of stocks that historically exhibit significant price momentum following an EA for the next seven days:

  1. Stocks exhibiting positive post-EA price moves are buy-candidates
  2. Stocks exhibiting negative post-EA price moves are sell/short-candidates

The screen includes those stocks whose Earnings just came out in last two days.

Screen criteria:

  1. Earnings Date Start Date : Current Date + -1 Day
  2. Earnings Date End Date : Current Date + -2 Days
  3. Predicted Move (Next Day) Max : 7%
  4. Predicted Move (On 7th Day) Min : 7%

Strategy Guideline:

  1. Buy the stock if stock has reacted positively. Short the stock if stock has reacted negatively (see above).
  2. Close the position in 7-10 days, or possibly earlier based on price move.

Volatility Crush Strategy - Best for Options Traders

The Volatility Crush strategy is used with stocks that typically experience relatively low-to-moderate price moves (≤4%) following their Earnings Announcements (EA). The basic trade idea is to sell put or call options right before the EA, collecting a credit when options premium is very high due to elevated implied volatility (IV). You then close the position right after the EA by buying the option back much cheaper due to the significant drop in IV that occurs after the mystery of the EA disappears. In assessing this trade, you need to do your homework to ensure you collect sufficient premium to make the trade worthwhile.

This trade is practical due to the low-to-moderate price-move after the EA, which generally won’t significantly affect the options price, unlike an “action” stock, which experience great price moves post-EA. With these symbols, if you’re on the right side of the price move, that’s a great thing. But if you’re on the wrong side of the move, not so great. Consequently, by minimizing the effect of the post-EA price move, you have a much better chance to profit from the reduction in IV without it being ruined by a violent price move.

For this trade, open the position either (1) the night before the EA when the company announces earnings or (2) during the EA day when it announces post-market, generally capturing IV at or close to its peak.

For this trade, open the position either (1) the night before the EA when the company announces earnings or (2) during the EA day when it announces post-market, generally capturing IV at or close to its peak.

This popular stockearnings screen will give you a list of stocks which do not react more than 4% fpost-EA. It includes only those stocks whose earnings are releasing next day.

Screen criteria:

  1. Earnings Date Start Date : Current Date + 1
  2. Earnings Date End Date : Current Date + 1
  3. Predicted Move (Next Day) Max : 4%
  4. Options Type: Weekly

Strategy Guideline:

  1. Options Strategy: Sell Call and Put
  2. Options Strike Price: Current Stock Price – (% Predicated Move x 2)
  3. Expiration Date: It should generally be the closest expiry immediately after the EA.
  4. Buy Insurance: Buying back Call and Put at Strike price which 10% lower than Sell Strike Price is optional but recommended.

Watch Video for More Detail

Volatility Rush Strategy - Best for Options Traders

The Volatility Rush takes advantage of increasing options premiums into earnings announcements (EA) caused by an anticipated rise in Implied Volatility (IV). With this strategy, Buy a Call and Put at-the-money (a long straddle) 2-3 weeks before the EA when IV is lower. Sell the position either (1) the night before the EA when the company announces earnings pre-market, or (2) during the EA day when it announces post-market, generally capturing IV at or close to its peak.

This popular screen will give you a list of stocks whose Options premiums tend to rise into Earnings. It includes only those stocks whose Earnings are at least two weeks away from today.

Screen criteria:

  1. Earnings Date Start Date : Current Date + 15 Days
  2. Earnings Date End Date : Current Date + 30 Days
  3. Predicted Move (Next Day) Min : 5%
  4. Options Type: Weekly or Monthly if that lines up with the two to three-week lead-time for entering the trade

Strategy Guideline:

  1. Buy a Straddle at or close to the money two to three weeks pre-EA.
  2. Sell the position either the night before the EA when the company announces earnings pre-market, or during the EA day when it announces post-market.
  3. Expiration date should generally be the closest expiry immediately after the EA.
  4. Straddle price should not be more 60% of predicted move.

Predicted Move (Volatility)

Similar to Implied Volatility in Options. Expected volatility % based on our Proprietary Volatility Predication Model. We are expecting that stock price will likely to reach % in either direction by the end of next trading session after Earnings are released and not necessarily the closing volatility %.

Why is it important?

    This indicator helps

  1. Knowing expected volatility in stocks after Earnings helps to decide trading stocks before Earnings Announcement.
  2. Taking Advantage of volatility collapse following Earnings Results by using Advance Options strategies such as Spread and Straddles.

Since Last Earnings

Change in share price since last Earnings release.

Why is it Important?

When share has gained more than 10% since it's last Earning release, it tends to over react to minor bad news and give up some gains if not all. So, it contains more downside volatility than upside When share has dropped more than 10% since it's last Earning release, it tends to over react to minor good news and recover some drops if not all. So, it contains more upside volatility than downside.

EPS Surprise (%)

Occurs when a company's reported quarterly or annual profits are above or below analysts' expectations. Here is the formula to derive % EPS Surprice:

Actual EPS - Estimated EPS
------------------------------------- x 100
Estimated EPS

Why is it Important?

Earnings surprises can have a huge impact on a company's stock price. Several studies suggest that positive earnings surprises not only lead to an immediate hike in a stock's price, but also to a gradual increase over time. Hence, it's not surprising that some companies are known for routinely beating earning projections. A negative earnings surprise will usually result in a decline in share price.

Next Day Price Change (%)

Next Regular trading session Closing price following Earnings result.

For After Market Close Earnings, It is a next trading day closing price. For Before Market Open Earnings, It is the same trading day closing price.

Why is it Important?

Next Day price change is a reaction of Earnings result.

UnitedHealth Q1 Earnings: Impressive Profits, But Only With Permission

Posted on Apr 21, 2026 by Grayson Cavern

UnitedHealth Q1 Earnings: Impressive Profits, But Only With Permission

Pressure rarely announces itself in a single quarter. It accumulates small concessions, deliberate exits, until the boundaries of what a business is allowed to earn have been redrawn without anyone formally announcing the change. That is the frame you need for UnitedHealth Group’s Q1 2026 earnings report. Though impressive, I see a company negotiating its profitability inside a system it no longer fully controls.

Margin Expansion Has a Hidden Price Tag

Right now, the headlines are going completely nuts over UnitedHealth Group, Inc (NYSE: UNH) figures: revenue of $111.7 billion, up roughly 2% year-over-year; adjusted EPS of $7.23; operating cash flow of $8.9 billion; and debt-to-capital of 42.9%. A profile of a business that still executes with discipline. But execution is not the story here. The method of execution is, and that distinction is where most investors stop paying attention.

UnitedHealthcare Group delivered $86.3 billion in revenue and $5.7 billion in operating income, with margins climbing to 6.6% from 6.2% and the medical cost ratio declining to 83.9% from 84.8%. On the surface, that reads like control. Clean, even. The kind of improvement that gets quoted in bull cases without further examination.

However, margins don’t expand in a regulated system without trade-offs – they are earned by choosing where not to participate as much as where to lean in. Total membership fell to 49.05 million from 50.1 million, including a reduction of roughly 965,000 Medicare Advantage members. Indicating that the company is tightening its exposure to areas where returns no longer justify the capital under current reimbursement conditions, and the margin improvement is the direct result of that exit. You cannot separate the two.

Washington’s Boogeyman strikes again


Let’s be precise about where the pressure originates, because pricing it correctly changes how you see this business going forward.

A significant portion of UnitedHealth’s revenue runs through government-backed programs – particularly Medicare Advantage – where reimbursement rates are not set by the company but determined in Washington. 

Earlier this year, initial Medicare rate proposals came in at roughly 0.09%, effectively flat, before being revised higher after sustained industry pushback. That sequence alone triggered sector-wide volatility because it exposed the underlying reality plainly: pricing power here is conditional.

When reimbursement moves, margins move with it. When reimbursement stalls, companies adjust or absorb, and UnitedHealth chose to adjust, shedding lower-return Medicare Advantage cohorts while tightening its medical cost ratio in the process. Put simply, UnitedHealth now profits under the government’s permission.

Can Optum Absorb All The Pressure?

For years, Optum was the layer that converted scale into higher-margin, diversified growth and justified a premium multiple. It still drives revenue. But the conversion is weakening, and that is a material shift in the investment thesis.

Optum Health reported $24.1 billion in revenue, down 3% year-over-year, with reported operating income of $1.141 billion and adjusted at $1.312 billion – a 5.4% margin. Optum Insight delivered $5.1 billion in revenue, but adjusted operating income dropped to $774 million. Optum Rx generated $35.7 billion in revenue, up 2%, while operating income slipped from $1.3 billion to $1.2 billion and scripts declined to 383 million from 408 million.

Yes, Revenue is holding. Earnings are compressing. Margins depend on adjustments rather than on clean operational leverage. But a growth engine in full stride does not produce these numbers. A system absorbing external pressure while trying to maintain its output does.

Patients and Volume Stood Strong, But…

Patients didn’t disappear, and neither did volume collapse. In fact, the system is still processing claims and moving members at scale. What changed is the quality of that volume – the margin attached to each dollar flowing through the business. Costs are higher. Investment remains elevated. Reimbursement is constrained. So the company does what disciplined operators do in this environment: it selects or exits where necessary, and defends where it can.

That is precisely how you get margin expansion alongside membership contraction, and revenue growth alongside earnings compression in key segments. Both outcomes are intentional, and holding them together is the only honest way to read this quarter.

What The Chart Looks Like

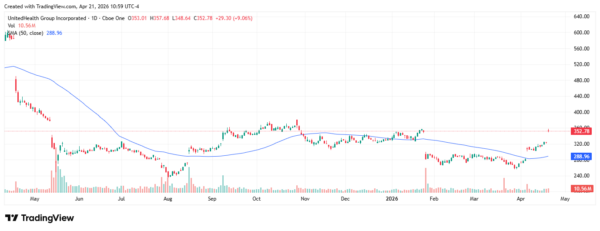
Just before the earnings hit, UnitedHealth Group was trading around the $300–$310 range, sitting just beneath its 50-day moving average and well below the declining 200-day, a setup that reflected hesitation

Premarket, the stock jumped over 6.8%, and that momentum carried into the session, pushing the price aggressively toward the $340–$350 zone, reclaiming both the 21-day and 50-day moving averages in one move. That kind of reclaim, in a single session, is not retail noise; it’s institutional repositioning. Volume confirms it, expanding meaningfully relative to prior sessions.

RSI pushed toward 60+, shifting out of neutral into bullish momentum without yet entering extreme overbought territory, exactly where sustained moves tend to build from.

Now, price is pressing into a prior supply zone while compressing beneath the 200-day. If that level gives way, you’re not looking at a bounce anymore but a trend transition. Signaling that the market is repricing the business’s durability under pressure, rather than its beat.

unitedhealth - StockEarnings

The Negotiation Is Just Getting Started

No doubt this quarter proves UnitedHealth can perform under pressure, further proving it as a good buy. What it does not prove is how much tighter conditions can get before the trade-offs migrate from segment margins and membership figures into the core numbers that investors anchor their entire thesis to. 

That is the question worth sitting with, and if you’ve been paying attention, you already know this is no longer a simple growth story, but a negotiation. One where profit still exists, but only with permission.

Join over 1.2M+ investors/traders who receive daily and weekly notable earnings alerts with predicted move