ajax loader

Loading...


Ride-the-Wave Strategy – Best for Stock Traders

Ride-the-Wave targets multi-day price momentum following a company’s earnings announcement (EA). With this strategy:

  1. Buy a stock one day post-EA if a stock reacts positively post-earnings:
    1. Near the close of trading the EA-day for a pre-market-EA
    2. Near the close of the following day for a post-market-EA
  2. Sell-to-close after 7-10 days, or possibly earlier if a desired price target is reached

Similarly,

  1. short a stock one day post-EA if a stock reacts negatively post-earnings:
    1. near the close of trading the EA-day for a premarket-EA
    2. near the close of the following day for a post-market-EA
  2. then buy-to-close after 7-10 days, or possibly earlier if a desired price target is reached

Important: Ride-the-Wave is predicated on significant price momentum triggered by an EA. The 7-10 day scenario is the maximum trade hold-time. If you see post EA-momentum is halted or reversed by a significant opposite move, re-evaluate your presence in the trade.

This popular StockEarnings screen below will give you a list of stocks that historically exhibit significant price momentum following an EA for the next seven days:

  1. Stocks exhibiting positive post-EA price moves are buy-candidates
  2. Stocks exhibiting negative post-EA price moves are sell/short-candidates

The screen includes those stocks whose Earnings just came out in last two days.

Screen criteria:

  1. Earnings Date Start Date : Current Date + -1 Day
  2. Earnings Date End Date : Current Date + -2 Days
  3. Predicted Move (Next Day) Max : 7%
  4. Predicted Move (On 7th Day) Min : 7%

Strategy Guideline:

  1. Buy the stock if stock has reacted positively. Short the stock if stock has reacted negatively (see above).
  2. Close the position in 7-10 days, or possibly earlier based on price move.

Volatility Crush Strategy - Best for Options Traders

The Volatility Crush strategy is used with stocks that typically experience relatively low-to-moderate price moves (≤4%) following their Earnings Announcements (EA). The basic trade idea is to sell put or call options right before the EA, collecting a credit when options premium is very high due to elevated implied volatility (IV). You then close the position right after the EA by buying the option back much cheaper due to the significant drop in IV that occurs after the mystery of the EA disappears. In assessing this trade, you need to do your homework to ensure you collect sufficient premium to make the trade worthwhile.

This trade is practical due to the low-to-moderate price-move after the EA, which generally won’t significantly affect the options price, unlike an “action” stock, which experience great price moves post-EA. With these symbols, if you’re on the right side of the price move, that’s a great thing. But if you’re on the wrong side of the move, not so great. Consequently, by minimizing the effect of the post-EA price move, you have a much better chance to profit from the reduction in IV without it being ruined by a violent price move.

For this trade, open the position either (1) the night before the EA when the company announces earnings or (2) during the EA day when it announces post-market, generally capturing IV at or close to its peak.

For this trade, open the position either (1) the night before the EA when the company announces earnings or (2) during the EA day when it announces post-market, generally capturing IV at or close to its peak.

This popular stockearnings screen will give you a list of stocks which do not react more than 4% fpost-EA. It includes only those stocks whose earnings are releasing next day.

Screen criteria:

  1. Earnings Date Start Date : Current Date + 1
  2. Earnings Date End Date : Current Date + 1
  3. Predicted Move (Next Day) Max : 4%
  4. Options Type: Weekly

Strategy Guideline:

  1. Options Strategy: Sell Call and Put
  2. Options Strike Price: Current Stock Price – (% Predicated Move x 2)
  3. Expiration Date: It should generally be the closest expiry immediately after the EA.
  4. Buy Insurance: Buying back Call and Put at Strike price which 10% lower than Sell Strike Price is optional but recommended.

Watch Video for More Detail

Volatility Rush Strategy - Best for Options Traders

The Volatility Rush takes advantage of increasing options premiums into earnings announcements (EA) caused by an anticipated rise in Implied Volatility (IV). With this strategy, Buy a Call and Put at-the-money (a long straddle) 2-3 weeks before the EA when IV is lower. Sell the position either (1) the night before the EA when the company announces earnings pre-market, or (2) during the EA day when it announces post-market, generally capturing IV at or close to its peak.

This popular screen will give you a list of stocks whose Options premiums tend to rise into Earnings. It includes only those stocks whose Earnings are at least two weeks away from today.

Screen criteria:

  1. Earnings Date Start Date : Current Date + 15 Days
  2. Earnings Date End Date : Current Date + 30 Days
  3. Predicted Move (Next Day) Min : 5%
  4. Options Type: Weekly or Monthly if that lines up with the two to three-week lead-time for entering the trade

Strategy Guideline:

  1. Buy a Straddle at or close to the money two to three weeks pre-EA.
  2. Sell the position either the night before the EA when the company announces earnings pre-market, or during the EA day when it announces post-market.
  3. Expiration date should generally be the closest expiry immediately after the EA.
  4. Straddle price should not be more 60% of predicted move.

Predicted Move (Volatility)

Similar to Implied Volatility in Options. Expected volatility % based on our Proprietary Volatility Predication Model. We are expecting that stock price will likely to reach % in either direction by the end of next trading session after Earnings are released and not necessarily the closing volatility %.

Why is it important?

    This indicator helps

  1. Knowing expected volatility in stocks after Earnings helps to decide trading stocks before Earnings Announcement.
  2. Taking Advantage of volatility collapse following Earnings Results by using Advance Options strategies such as Spread and Straddles.

Since Last Earnings

Change in share price since last Earnings release.

Why is it Important?

When share has gained more than 10% since it's last Earning release, it tends to over react to minor bad news and give up some gains if not all. So, it contains more downside volatility than upside When share has dropped more than 10% since it's last Earning release, it tends to over react to minor good news and recover some drops if not all. So, it contains more upside volatility than downside.

EPS Surprise (%)

Occurs when a company's reported quarterly or annual profits are above or below analysts' expectations. Here is the formula to derive % EPS Surprice:

Actual EPS - Estimated EPS
------------------------------------- x 100
Estimated EPS

Why is it Important?

Earnings surprises can have a huge impact on a company's stock price. Several studies suggest that positive earnings surprises not only lead to an immediate hike in a stock's price, but also to a gradual increase over time. Hence, it's not surprising that some companies are known for routinely beating earning projections. A negative earnings surprise will usually result in a decline in share price.

Next Day Price Change (%)

Next Regular trading session Closing price following Earnings result.

For After Market Close Earnings, It is a next trading day closing price. For Before Market Open Earnings, It is the same trading day closing price.

Why is it Important?

Next Day price change is a reaction of Earnings result.

True to Form, TJX Companies (TJX) Stock May Offer a Legitimate Discount

Posted on Jun 30, 2026 by Joshua Enomoto

True to Form, TJX Companies (TJX) Stock May Offer a Legitimate Discount

Contrarianism doesn’t have to be outright sexy: just look at TJX Companies (NYSE: TJX). At first glance, TJX stock may not seem like a compelling discount because the narrative is too much on the nose. After all, the off-price retailer specializes in providing name-brand goods at a reduced price. There’s no real hunting involved, no financial gymnastics to make the point stick.

However, being a contrarian investor shouldn’t exclusively cater to exotic ideas. Sometimes, you can find great value hiding in plain sight. I believe that’s the case for TJX stock. Yes, it’s a solid investment for all the reasons you think it is. But it also offers short-term profit scalpers — weaponizing the leverage of the options market — a legitimately compelling trade.

First, let’s consider the standard argument favoring TJX stock. On a year-to-date basis, the security’s performance is rather pedestrian at less than 1% up. Much of that stems from recent volatility. In the trailing five days, TJX suffered a loss of more than 6%, a negative rerating for reasons that I believe are excessive.

Clearly, the market didn’t like the more measured outlook that management provided following prior quarters of solid growth. Minor insider selling also didn’t help matters as it tends to send ambiguous (or even conflicting) messages. Still, these matters appear to resemble hiccups rather than deep-seated structural deficits.

Fundamentally, the trade-down effect should help keep the lights on for TJX stock. When difficult economic circumstances hit consumers, they don’t go cold turkey on their purchases. Instead, they look to cheaper alternatives for the products that they want or need. TJX Companies fills that need inherently, thus driving the case for permanent relevance.

Additionally, management has greenlighted sizable scale efficiencies, with TJX planning to add 146 new stores globally this year. Ultimately, the company is eyeballing a goal of 7,000 stores worldwide. Such ambitions likely wouldn’t arise if the fundamentals didn’t justify it.

Conditioned Data Points to a Compelling Trade for TJX Stock


Although the contrarian case for TJX stock may seem like a no-brainer, it’s also difficult to make the case strictly from the fundamental perspective. Sure, TJX Companies benefits from the trade-down effect but how do we know that the market didn’t already take that narrative into account?

In other words, who is to say that the “market is wrong”? It’s perfectly reasonable to believe that TJX stock fully deserved the 6.19% loss over the last five days based on its present risk-reward profile. Essentially, such reasoning becomes one opinion versus another. That’s very unsatisfying for the intellectual trader and fortunately, we can use a more empirical methodology to better determine true value.

It’s a reasonably safe bet that most of us reject the idea that the equities market is purely random; otherwise, you reading financial articles in a bid to gain an edge would be considered an exercise in collective delusion. Therefore, if you were to use a particular system or signal to trade TJX stock, at the very minimum, this methodology must consistently beat the performance of you trading TJX randomly.

Again, if the equities market were truly random, then you would just buy TJX stock at any time rather than read articles (like mine) telling you when you should buy…and when you shouldn’t buy. However, you don’t believe that, which is what brings you here. The difference that I’m bringing to the table is quantifying the decision-making process.

tjx-StockEarnings

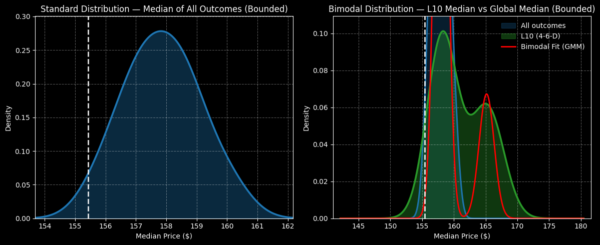
Using historical data over the last six-and-a-half years, if you were to buy TJX stock at random and hold it for a 10-week period, your expected forward distribution would land somewhere between $154 and $162 (assuming a starting price of $155.43, Friday’s close). Further, probability density would peak near $158, meaning that TJX commands an upward bias.

This is the random baseline performance that our trading signal needs to beat. Now, at this particular time, TJX stock has printed four up weeks over the last 10 weeks, resulting in a downward slope across the period. Conditioned for this 4-6-D sequence, bullish traders can expect a forward 10-week distribution landing between $150 and $175, with average probability density peaking around $160.

Because the net statistical tendency stemming from the 4-6-D sequence is noticeably superior to the baseline benchmark, traders arguably have a reason to consider the contrarian trade in TJX stock.

Narrowing Down a Specific Idea

Of course, when trading options, you’re dealing with specifics: hard price targets, hard expiration dates. While forward distributions are instructive, they cover a broad range of outcomes. Fortunately, we can break down the above data on a week-by-week basis.

Interestingly, TJX stock — upon flashing the 4-6-D signal — tends to rise higher in the seventh to eighth week in the projected distribution. Further, the 75th percentile pathway, along with the 25th percentile pathway, also tends to rise during the aforementioned period. Stated differently, the holistic risk-reward structure has been observed to elevate during this time, possibly allowing traders to exploit this information ahead of time.

tjx-StockEarnings

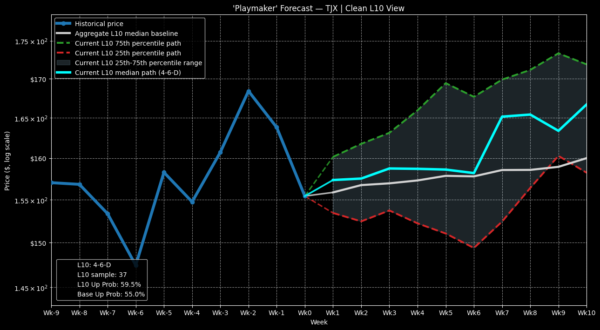
If you believe in the insights of this inductive model, one aggressive idea to consider is the 165/170 bull call spread expiring Aug. 21. On a good day, it is well within statistical reality for TJX stock to hit the $170 strike at expiration. If so, the maximum payout on this bull spread comes out to over 194%.

While the spread itself is quite narrow, the breakeven price comes in at $166.70. That’s roughly the median price that would be expected under 4-6-D conditions, thus providing the trade with a theoretical margin of safety.

Please don’t get this wrong, however. This is still an aggressive and risky proposition. Most importantly, all inductive methodologies are susceptible to the black swan risk: just because you see a thousand white swans doesn’t mean that all swans are white. All it takes is for TJX stock to not follow prior trends for this trade to blow up in a bad way — and there’s no rule that states past patterns must always repeat.

With that caveat aside, I believe an empirical analysis such as the one above is superior to fundamental or technical analysis, which relies on unverifiable opinions. No one can arbitrate whether the market is right or wrong. What we can do is to recognize how markets respond given certain conditions.

Right now, TJX stock is structurally in a bearish state — and that has tended to resolve itself bullishly. That’s the opportunity that options traders have to potentially exploit.

Joshua Enomoto is a seasoned financial writer with a strong track record of in-depth stock analysis, offering clear, insightful commentary for retail investors across all levels of expertise. Renowned for his ability to blend analytical rigor with engaging wit, Joshua's work has been featured on leading investment platforms, including TipRanks, InvestorPlace, Barchart, Benzinga, and Fintel. He was also handpicked to spearhead high-impact initiatives such as InvestorPlace's "Trade of the Day" and Benzinga’s ETF coverage. As a frequent guest expert for CGTN America, Joshua discusses a wide range of economic, societal, and consumer market trends. A graduate of U.C. San Diego, Joshua brings a thoughtful and fresh perspective to complex financial narratives, helping enterprise clients connect with their audiences. He also composes music in his spare time.

Join over 1.2M+ investors/traders who receive daily and weekly notable earnings alerts with predicted move