ajax loader

Loading...


Ride-the-Wave Strategy – Best for Stock Traders

Ride-the-Wave targets multi-day price momentum following a company’s earnings announcement (EA). With this strategy:

  1. Buy a stock one day post-EA if a stock reacts positively post-earnings:
    1. Near the close of trading the EA-day for a pre-market-EA
    2. Near the close of the following day for a post-market-EA
  2. Sell-to-close after 7-10 days, or possibly earlier if a desired price target is reached

Similarly,

  1. short a stock one day post-EA if a stock reacts negatively post-earnings:
    1. near the close of trading the EA-day for a premarket-EA
    2. near the close of the following day for a post-market-EA
  2. then buy-to-close after 7-10 days, or possibly earlier if a desired price target is reached

Important: Ride-the-Wave is predicated on significant price momentum triggered by an EA. The 7-10 day scenario is the maximum trade hold-time. If you see post EA-momentum is halted or reversed by a significant opposite move, re-evaluate your presence in the trade.

This popular StockEarnings screen below will give you a list of stocks that historically exhibit significant price momentum following an EA for the next seven days:

  1. Stocks exhibiting positive post-EA price moves are buy-candidates
  2. Stocks exhibiting negative post-EA price moves are sell/short-candidates

The screen includes those stocks whose Earnings just came out in last two days.

Screen criteria:

  1. Earnings Date Start Date : Current Date + -1 Day
  2. Earnings Date End Date : Current Date + -2 Days
  3. Predicted Move (Next Day) Max : 7%
  4. Predicted Move (On 7th Day) Min : 7%

Strategy Guideline:

  1. Buy the stock if stock has reacted positively. Short the stock if stock has reacted negatively (see above).
  2. Close the position in 7-10 days, or possibly earlier based on price move.

Volatility Crush Strategy - Best for Options Traders

The Volatility Crush strategy is used with stocks that typically experience relatively low-to-moderate price moves (≤4%) following their Earnings Announcements (EA). The basic trade idea is to sell put or call options right before the EA, collecting a credit when options premium is very high due to elevated implied volatility (IV). You then close the position right after the EA by buying the option back much cheaper due to the significant drop in IV that occurs after the mystery of the EA disappears. In assessing this trade, you need to do your homework to ensure you collect sufficient premium to make the trade worthwhile.

This trade is practical due to the low-to-moderate price-move after the EA, which generally won’t significantly affect the options price, unlike an “action” stock, which experience great price moves post-EA. With these symbols, if you’re on the right side of the price move, that’s a great thing. But if you’re on the wrong side of the move, not so great. Consequently, by minimizing the effect of the post-EA price move, you have a much better chance to profit from the reduction in IV without it being ruined by a violent price move.

For this trade, open the position either (1) the night before the EA when the company announces earnings or (2) during the EA day when it announces post-market, generally capturing IV at or close to its peak.

For this trade, open the position either (1) the night before the EA when the company announces earnings or (2) during the EA day when it announces post-market, generally capturing IV at or close to its peak.

This popular stockearnings screen will give you a list of stocks which do not react more than 4% fpost-EA. It includes only those stocks whose earnings are releasing next day.

Screen criteria:

  1. Earnings Date Start Date : Current Date + 1
  2. Earnings Date End Date : Current Date + 1
  3. Predicted Move (Next Day) Max : 4%
  4. Options Type: Weekly

Strategy Guideline:

  1. Options Strategy: Sell Call and Put
  2. Options Strike Price: Current Stock Price – (% Predicated Move x 2)
  3. Expiration Date: It should generally be the closest expiry immediately after the EA.
  4. Buy Insurance: Buying back Call and Put at Strike price which 10% lower than Sell Strike Price is optional but recommended.

Watch Video for More Detail

Volatility Rush Strategy - Best for Options Traders

The Volatility Rush takes advantage of increasing options premiums into earnings announcements (EA) caused by an anticipated rise in Implied Volatility (IV). With this strategy, Buy a Call and Put at-the-money (a long straddle) 2-3 weeks before the EA when IV is lower. Sell the position either (1) the night before the EA when the company announces earnings pre-market, or (2) during the EA day when it announces post-market, generally capturing IV at or close to its peak.

This popular screen will give you a list of stocks whose Options premiums tend to rise into Earnings. It includes only those stocks whose Earnings are at least two weeks away from today.

Screen criteria:

  1. Earnings Date Start Date : Current Date + 15 Days
  2. Earnings Date End Date : Current Date + 30 Days
  3. Predicted Move (Next Day) Min : 5%
  4. Options Type: Weekly or Monthly if that lines up with the two to three-week lead-time for entering the trade

Strategy Guideline:

  1. Buy a Straddle at or close to the money two to three weeks pre-EA.
  2. Sell the position either the night before the EA when the company announces earnings pre-market, or during the EA day when it announces post-market.
  3. Expiration date should generally be the closest expiry immediately after the EA.
  4. Straddle price should not be more 60% of predicted move.

Predicted Move (Volatility)

Similar to Implied Volatility in Options. Expected volatility % based on our Proprietary Volatility Predication Model. We are expecting that stock price will likely to reach % in either direction by the end of next trading session after Earnings are released and not necessarily the closing volatility %.

Why is it important?

    This indicator helps

  1. Knowing expected volatility in stocks after Earnings helps to decide trading stocks before Earnings Announcement.
  2. Taking Advantage of volatility collapse following Earnings Results by using Advance Options strategies such as Spread and Straddles.

Since Last Earnings

Change in share price since last Earnings release.

Why is it Important?

When share has gained more than 10% since it's last Earning release, it tends to over react to minor bad news and give up some gains if not all. So, it contains more downside volatility than upside When share has dropped more than 10% since it's last Earning release, it tends to over react to minor good news and recover some drops if not all. So, it contains more upside volatility than downside.

EPS Surprise (%)

Occurs when a company's reported quarterly or annual profits are above or below analysts' expectations. Here is the formula to derive % EPS Surprice:

Actual EPS - Estimated EPS
------------------------------------- x 100
Estimated EPS

Why is it Important?

Earnings surprises can have a huge impact on a company's stock price. Several studies suggest that positive earnings surprises not only lead to an immediate hike in a stock's price, but also to a gradual increase over time. Hence, it's not surprising that some companies are known for routinely beating earning projections. A negative earnings surprise will usually result in a decline in share price.

Next Day Price Change (%)

Next Regular trading session Closing price following Earnings result.

For After Market Close Earnings, It is a next trading day closing price. For Before Market Open Earnings, It is the same trading day closing price.

Why is it Important?

Next Day price change is a reaction of Earnings result.

Dogs of the Dow 2026: One of the Best Investment Strategies

Posted on Jun 29, 2026 by Ian Cooper

Dogs of the Dow 2026: One of the Best Investment Strategies

For investors looking to build wealth with blue-chip dividend stocks, few strategies have stood the test of time like the Dogs of the Dow. 

The simple approach focuses on buying the 10 highest-yielding stocks in the Dow Jones Industrial Average at the beginning of each year and holding them for 12 months. Historically, the strategy has generated competitive returns, strong dividend income, and downside protection during volatile markets. 

After another solid showing in 2025, the Dogs of the Dow are once again proving their value in 2026, with several of this year’s top-yielding Dow components already posting impressive gains. Here’s a closer look at how the strategy performed last year, how it’s doing so far in 2026, and why income-focused investors continue to rely on this time-tested investing approach.

How the Dogs of the Dow Performed in 2025


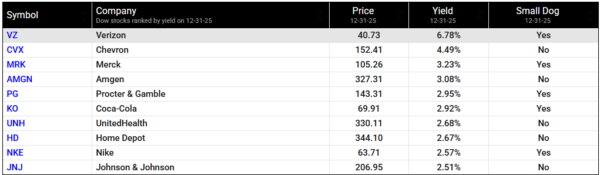
For 2025, here’s how the Dogs of the Dow did.

That’s not bad at all.

Plus, once you factor in the yields for each, the Dogs outperformed the Dow Jones.

Dogs of the Dow Off to Strong Start in 2026

As for 2026, here’s how the Dogs of the Dow have performed to date.

  • Verizon (VZ), which yields 6.51%, ran from $39.48 to a current price of $43.52.
  • Chevron (CVX), which yields 4.2%, ran from $149.32 to $169.15.
  • Merck (MRK), which yields 2.64%, ran from about $104.01 to $128.88.
  • Procter & Gamble (PG), which yields 2.95%, ran from $141.04 to $147.81.
  • Amgen (AMGN), which yields 2.8%, ran from $324.06 to $359.76.
  • Coca-Cola (KO), which yields 2.57%, ran from $68.95 to $82.77.
  • Nike (NYSE: NKE), which yields 3.98%, fell from $63.01 to $41.24.
  • UnitedHealth (NYSE: UNH), which yields 2.22%, ran from $326.43 to $419.04.
  • Home Depot (NYSE: HD), which yields 2.67%, ran from $338.61 to $348.76.
  • Johnson & Johnson (JNJ), which yields 2.09%, ran from $204.55 to $256.24.
dogs of the dow-StockEarnings

Why this Strategy Still Works

Historically, the Dogs of the Dow do very well.

The 2024 Dogs of the Dow underperformed the major indices in 2024. However, with dividends, investors still did well for the year.

The 2023 Dogs of the Dow returned an average of 10.1%, which came in below the 14.4% return on the Dow Jones’ Industrials. Still, with the appreciation in most of the 2023 Dogs coupled with dividends, investors still did well overall.

The 2022 Dogs of the Dow beat the major indices, even in a rough year.

In fact, while the Dogs of the Dow stocks fell 1.6% on the year, once you add in the dividend payouts, the Dogs returned 2% on the year. And while 2% may not sound like a big win, consider that, in 2022, one of the worst years on record since 2008, the NASDAQ lost 33%.  The S&P 500 lost 19%.  The Dow Jones lost about 9%.

In 2021, the Dogs of the Dow returned about 16.3%. While 2020 wasn’t a great year for the Dogs, most other years have done very well.  In 2019, the Dogs were up 20%.  In 2018, they were up about 1%, but still beat the Dow, which fell close to 6%.  In 2017, the dogs were up 19%.  In 2016, they were up 16%.

The Long-Term Outlook

With several of the 2026 Dogs already delivering solid gains and continuing to pay dependable dividends, the strategy remains an appealing option for investors seeking income, stability, and long-term growth. As always, diversification and patience are key, but for those looking for a straightforward, historically successful investing strategy, the Dogs of the Dow continue to earn their place in a well-balanced portfolio.

Over the last 26 years, he’s taught thousands of investors how to trade news flow and herd mentality using a unique blend of technical and fundamental analysis. Cooper was among the few analysts to spot the financial crisis of 2008, the top of subprime and Alt-A, the death of Lehman Brothers, Bear Stearns, and New Century Financial, and even the Dow’s collapse to 6,500, as well as its recovery. He even called for gold to rally well above $1.500 when it traded under $600. At the moment, Cooper makes use of technical, fundamental and news analysis, to help individual investors grow their wealth. He’s a firm believer that hard work and thorough research will lead to investment success.

Join over 1.2M+ investors/traders who receive daily and weekly notable earnings alerts with predicted move