ajax loader

Loading...


Ride-the-Wave Strategy – Best for Stock Traders

Ride-the-Wave targets multi-day price momentum following a company’s earnings announcement (EA). With this strategy:

  1. Buy a stock one day post-EA if a stock reacts positively post-earnings:
    1. Near the close of trading the EA-day for a pre-market-EA
    2. Near the close of the following day for a post-market-EA
  2. Sell-to-close after 7-10 days, or possibly earlier if a desired price target is reached

Similarly,

  1. short a stock one day post-EA if a stock reacts negatively post-earnings:
    1. near the close of trading the EA-day for a premarket-EA
    2. near the close of the following day for a post-market-EA
  2. then buy-to-close after 7-10 days, or possibly earlier if a desired price target is reached

Important: Ride-the-Wave is predicated on significant price momentum triggered by an EA. The 7-10 day scenario is the maximum trade hold-time. If you see post EA-momentum is halted or reversed by a significant opposite move, re-evaluate your presence in the trade.

This popular StockEarnings screen below will give you a list of stocks that historically exhibit significant price momentum following an EA for the next seven days:

  1. Stocks exhibiting positive post-EA price moves are buy-candidates
  2. Stocks exhibiting negative post-EA price moves are sell/short-candidates

The screen includes those stocks whose Earnings just came out in last two days.

Screen criteria:

  1. Earnings Date Start Date : Current Date + -1 Day
  2. Earnings Date End Date : Current Date + -2 Days
  3. Predicted Move (Next Day) Max : 7%
  4. Predicted Move (On 7th Day) Min : 7%

Strategy Guideline:

  1. Buy the stock if stock has reacted positively. Short the stock if stock has reacted negatively (see above).
  2. Close the position in 7-10 days, or possibly earlier based on price move.

Volatility Crush Strategy - Best for Options Traders

The Volatility Crush strategy is used with stocks that typically experience relatively low-to-moderate price moves (≤4%) following their Earnings Announcements (EA). The basic trade idea is to sell put or call options right before the EA, collecting a credit when options premium is very high due to elevated implied volatility (IV). You then close the position right after the EA by buying the option back much cheaper due to the significant drop in IV that occurs after the mystery of the EA disappears. In assessing this trade, you need to do your homework to ensure you collect sufficient premium to make the trade worthwhile.

This trade is practical due to the low-to-moderate price-move after the EA, which generally won’t significantly affect the options price, unlike an “action” stock, which experience great price moves post-EA. With these symbols, if you’re on the right side of the price move, that’s a great thing. But if you’re on the wrong side of the move, not so great. Consequently, by minimizing the effect of the post-EA price move, you have a much better chance to profit from the reduction in IV without it being ruined by a violent price move.

For this trade, open the position either (1) the night before the EA when the company announces earnings or (2) during the EA day when it announces post-market, generally capturing IV at or close to its peak.

For this trade, open the position either (1) the night before the EA when the company announces earnings or (2) during the EA day when it announces post-market, generally capturing IV at or close to its peak.

This popular stockearnings screen will give you a list of stocks which do not react more than 4% fpost-EA. It includes only those stocks whose earnings are releasing next day.

Screen criteria:

  1. Earnings Date Start Date : Current Date + 1
  2. Earnings Date End Date : Current Date + 1
  3. Predicted Move (Next Day) Max : 4%
  4. Options Type: Weekly

Strategy Guideline:

  1. Options Strategy: Sell Call and Put
  2. Options Strike Price: Current Stock Price – (% Predicated Move x 2)
  3. Expiration Date: It should generally be the closest expiry immediately after the EA.
  4. Buy Insurance: Buying back Call and Put at Strike price which 10% lower than Sell Strike Price is optional but recommended.

Watch Video for More Detail

Volatility Rush Strategy - Best for Options Traders

The Volatility Rush takes advantage of increasing options premiums into earnings announcements (EA) caused by an anticipated rise in Implied Volatility (IV). With this strategy, Buy a Call and Put at-the-money (a long straddle) 2-3 weeks before the EA when IV is lower. Sell the position either (1) the night before the EA when the company announces earnings pre-market, or (2) during the EA day when it announces post-market, generally capturing IV at or close to its peak.

This popular screen will give you a list of stocks whose Options premiums tend to rise into Earnings. It includes only those stocks whose Earnings are at least two weeks away from today.

Screen criteria:

  1. Earnings Date Start Date : Current Date + 15 Days
  2. Earnings Date End Date : Current Date + 30 Days
  3. Predicted Move (Next Day) Min : 5%
  4. Options Type: Weekly or Monthly if that lines up with the two to three-week lead-time for entering the trade

Strategy Guideline:

  1. Buy a Straddle at or close to the money two to three weeks pre-EA.
  2. Sell the position either the night before the EA when the company announces earnings pre-market, or during the EA day when it announces post-market.
  3. Expiration date should generally be the closest expiry immediately after the EA.
  4. Straddle price should not be more 60% of predicted move.

Predicted Move (Volatility)

Similar to Implied Volatility in Options. Expected volatility % based on our Proprietary Volatility Predication Model. We are expecting that stock price will likely to reach % in either direction by the end of next trading session after Earnings are released and not necessarily the closing volatility %.

Why is it important?

    This indicator helps

  1. Knowing expected volatility in stocks after Earnings helps to decide trading stocks before Earnings Announcement.
  2. Taking Advantage of volatility collapse following Earnings Results by using Advance Options strategies such as Spread and Straddles.

Since Last Earnings

Change in share price since last Earnings release.

Why is it Important?

When share has gained more than 10% since it's last Earning release, it tends to over react to minor bad news and give up some gains if not all. So, it contains more downside volatility than upside When share has dropped more than 10% since it's last Earning release, it tends to over react to minor good news and recover some drops if not all. So, it contains more upside volatility than downside.

EPS Surprise (%)

Occurs when a company's reported quarterly or annual profits are above or below analysts' expectations. Here is the formula to derive % EPS Surprice:

Actual EPS - Estimated EPS
------------------------------------- x 100
Estimated EPS

Why is it Important?

Earnings surprises can have a huge impact on a company's stock price. Several studies suggest that positive earnings surprises not only lead to an immediate hike in a stock's price, but also to a gradual increase over time. Hence, it's not surprising that some companies are known for routinely beating earning projections. A negative earnings surprise will usually result in a decline in share price.

Next Day Price Change (%)

Next Regular trading session Closing price following Earnings result.

For After Market Close Earnings, It is a next trading day closing price. For Before Market Open Earnings, It is the same trading day closing price.

Why is it Important?

Next Day price change is a reaction of Earnings result.

3 Option Income ETFs Every Investor Should Know

Posted on Jun 29, 2026 by Ian Cooper

3 Option Income ETFs Every Investor Should Know

Dividend-paying option income ETFs have become increasingly popular with income-focused investors because they can generate attractive cash flow regardless of whether the broader market is moving higher or sideways. Unlike traditional dividend stocks that rely solely on company payouts, many of these ETFs enhance income by selling covered call options on their underlying holdings.

The premiums collected from those options are then distributed to shareholders, often resulting in yields that far exceed those of the broader stock market. For retirees and other income investors, this can provide a steady stream of monthly cash flow while still maintaining exposure to high-quality stocks and major market indexes.

That combination of income and diversification makes dividend-paying option ETFs an attractive choice for investors seeking a balance between growth and income. Here are three ETFs investors may want to consider.

Generate Income Twice Every Week


With an expense ratio of 1.04% and a twice-weekly dividend, the Defiance Nasdaq 100 Lightning Spread Income ETF (NASDAQ: QLDY) uses zero-days-to-expiration (0DTE) put spreads in an effort to capture time decay from short-dated options. It also seeks income and capital growth by using call options and 0DTE put spreads on the Nasdaq 100 Index. 

It does not invest directly in Nasdaq 100 stocks. The fund also pays dividends twice weekly.  It just paid a dividend of just over 17 cents on June 29. Before that, it paid just over 18 cents on June 25. Before that, it paid just over 17 cents on June 23. And before that, it paid just over 18 cents per share on June 18.

Targeting Double-Digit Yield

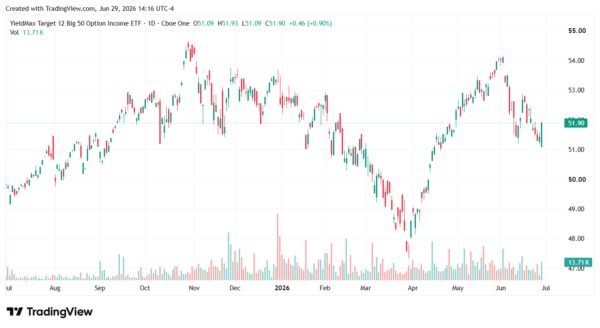
With an expense ratio of 1.09%, a distribution rate of 12%, and a monthly dividend, the YieldMax Target 12 Big 50 Option Income ETF (NYSEARCA: BIGY) is an actively managed ETF that targets a 12% annual yield and capital appreciation by investing in 15 to 30 U.S. large cap stocks. To generate income, the ETF primarily sells call options and call spreads on its holdings. It also generates capital appreciation through direct equity investments.

Most recently, the BIGY ETF paid a dividend of just over 53 cents per share on June 4. Before that, it paid out just over 52 cents per share on May 7. And before that, it paid out just over 48 cents per share on April 9.

option income etf-StockEarnings

International Dividend Income With Lower Volatility

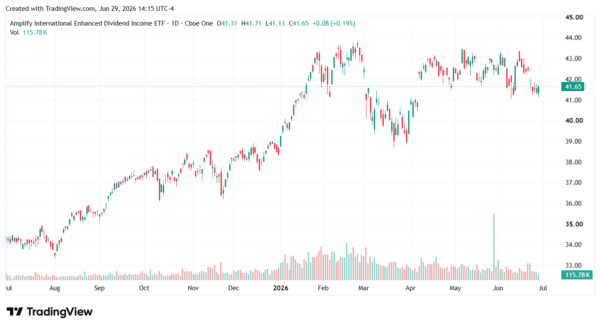
With an expense ratio of 0.65%, a distribution rate of 6.08%, and a 30-Day SEC Yield of 1.6%, the Amplify CWP International Enhanced Dividend income ETF (NYSEARCA: IDVO) provides income from international dividend stocks by writing covered calls on those stocks. Making it even more attractive, the dividends and options income help reduce share price volatility, as compared to the broader market, especially when markets drop.

Most recently, the fund paid a dividend of just over 20 cents p3r share on June 30. Before that, it paid out just over 21 cents per share on May 29. And before that, it paid out just over 21 cents per share on April 30.

option income etf-StockEarnings

Why Option Income ETFs Deserve a Look

While dividend-paying option ETFs aren’t designed to deliver the same long-term upside as traditional equity funds, they can play an important role in an income-focused portfolio. By combining stock ownership with options strategies, these funds seek to generate consistent cash distributions that can help offset market volatility and provide dependable income.

Whether you’re looking for frequent payouts with QLDY, a targeted double-digit yield with BIGY, or diversified international income through IDVO, each ETF offers a unique approach to enhancing portfolio cash flow. As always, investors should understand the risks associated with options-based strategies and consider how these funds fit within their overall investment objectives before adding them to a portfolio.

Over the last 26 years, he’s taught thousands of investors how to trade news flow and herd mentality using a unique blend of technical and fundamental analysis. Cooper was among the few analysts to spot the financial crisis of 2008, the top of subprime and Alt-A, the death of Lehman Brothers, Bear Stearns, and New Century Financial, and even the Dow’s collapse to 6,500, as well as its recovery. He even called for gold to rally well above $1.500 when it traded under $600. At the moment, Cooper makes use of technical, fundamental and news analysis, to help individual investors grow their wealth. He’s a firm believer that hard work and thorough research will lead to investment success.

Join over 1.2M+ investors/traders who receive daily and weekly notable earnings alerts with predicted move