ajax loader

Loading...


Ride-the-Wave Strategy – Best for Stock Traders

Ride-the-Wave targets multi-day price momentum following a company’s earnings announcement (EA). With this strategy:

  1. Buy a stock one day post-EA if a stock reacts positively post-earnings:
    1. Near the close of trading the EA-day for a pre-market-EA
    2. Near the close of the following day for a post-market-EA
  2. Sell-to-close after 7-10 days, or possibly earlier if a desired price target is reached

Similarly,

  1. short a stock one day post-EA if a stock reacts negatively post-earnings:
    1. near the close of trading the EA-day for a premarket-EA
    2. near the close of the following day for a post-market-EA
  2. then buy-to-close after 7-10 days, or possibly earlier if a desired price target is reached

Important: Ride-the-Wave is predicated on significant price momentum triggered by an EA. The 7-10 day scenario is the maximum trade hold-time. If you see post EA-momentum is halted or reversed by a significant opposite move, re-evaluate your presence in the trade.

This popular StockEarnings screen below will give you a list of stocks that historically exhibit significant price momentum following an EA for the next seven days:

  1. Stocks exhibiting positive post-EA price moves are buy-candidates
  2. Stocks exhibiting negative post-EA price moves are sell/short-candidates

The screen includes those stocks whose Earnings just came out in last two days.

Screen criteria:

  1. Earnings Date Start Date : Current Date + -1 Day
  2. Earnings Date End Date : Current Date + -2 Days
  3. Predicted Move (Next Day) Max : 7%
  4. Predicted Move (On 7th Day) Min : 7%

Strategy Guideline:

  1. Buy the stock if stock has reacted positively. Short the stock if stock has reacted negatively (see above).
  2. Close the position in 7-10 days, or possibly earlier based on price move.

Volatility Crush Strategy - Best for Options Traders

The Volatility Crush strategy is used with stocks that typically experience relatively low-to-moderate price moves (≤4%) following their Earnings Announcements (EA). The basic trade idea is to sell put or call options right before the EA, collecting a credit when options premium is very high due to elevated implied volatility (IV). You then close the position right after the EA by buying the option back much cheaper due to the significant drop in IV that occurs after the mystery of the EA disappears. In assessing this trade, you need to do your homework to ensure you collect sufficient premium to make the trade worthwhile.

This trade is practical due to the low-to-moderate price-move after the EA, which generally won’t significantly affect the options price, unlike an “action” stock, which experience great price moves post-EA. With these symbols, if you’re on the right side of the price move, that’s a great thing. But if you’re on the wrong side of the move, not so great. Consequently, by minimizing the effect of the post-EA price move, you have a much better chance to profit from the reduction in IV without it being ruined by a violent price move.

For this trade, open the position either (1) the night before the EA when the company announces earnings or (2) during the EA day when it announces post-market, generally capturing IV at or close to its peak.

For this trade, open the position either (1) the night before the EA when the company announces earnings or (2) during the EA day when it announces post-market, generally capturing IV at or close to its peak.

This popular stockearnings screen will give you a list of stocks which do not react more than 4% fpost-EA. It includes only those stocks whose earnings are releasing next day.

Screen criteria:

  1. Earnings Date Start Date : Current Date + 1
  2. Earnings Date End Date : Current Date + 1
  3. Predicted Move (Next Day) Max : 4%
  4. Options Type: Weekly

Strategy Guideline:

  1. Options Strategy: Sell Call and Put
  2. Options Strike Price: Current Stock Price – (% Predicated Move x 2)
  3. Expiration Date: It should generally be the closest expiry immediately after the EA.
  4. Buy Insurance: Buying back Call and Put at Strike price which 10% lower than Sell Strike Price is optional but recommended.

Watch Video for More Detail

Volatility Rush Strategy - Best for Options Traders

The Volatility Rush takes advantage of increasing options premiums into earnings announcements (EA) caused by an anticipated rise in Implied Volatility (IV). With this strategy, Buy a Call and Put at-the-money (a long straddle) 2-3 weeks before the EA when IV is lower. Sell the position either (1) the night before the EA when the company announces earnings pre-market, or (2) during the EA day when it announces post-market, generally capturing IV at or close to its peak.

This popular screen will give you a list of stocks whose Options premiums tend to rise into Earnings. It includes only those stocks whose Earnings are at least two weeks away from today.

Screen criteria:

  1. Earnings Date Start Date : Current Date + 15 Days
  2. Earnings Date End Date : Current Date + 30 Days
  3. Predicted Move (Next Day) Min : 5%
  4. Options Type: Weekly or Monthly if that lines up with the two to three-week lead-time for entering the trade

Strategy Guideline:

  1. Buy a Straddle at or close to the money two to three weeks pre-EA.
  2. Sell the position either the night before the EA when the company announces earnings pre-market, or during the EA day when it announces post-market.
  3. Expiration date should generally be the closest expiry immediately after the EA.
  4. Straddle price should not be more 60% of predicted move.

Predicted Move (Volatility)

Similar to Implied Volatility in Options. Expected volatility % based on our Proprietary Volatility Predication Model. We are expecting that stock price will likely to reach % in either direction by the end of next trading session after Earnings are released and not necessarily the closing volatility %.

Why is it important?

    This indicator helps

  1. Knowing expected volatility in stocks after Earnings helps to decide trading stocks before Earnings Announcement.
  2. Taking Advantage of volatility collapse following Earnings Results by using Advance Options strategies such as Spread and Straddles.

Since Last Earnings

Change in share price since last Earnings release.

Why is it Important?

When share has gained more than 10% since it's last Earning release, it tends to over react to minor bad news and give up some gains if not all. So, it contains more downside volatility than upside When share has dropped more than 10% since it's last Earning release, it tends to over react to minor good news and recover some drops if not all. So, it contains more upside volatility than downside.

EPS Surprise (%)

Occurs when a company's reported quarterly or annual profits are above or below analysts' expectations. Here is the formula to derive % EPS Surprice:

Actual EPS - Estimated EPS
------------------------------------- x 100
Estimated EPS

Why is it Important?

Earnings surprises can have a huge impact on a company's stock price. Several studies suggest that positive earnings surprises not only lead to an immediate hike in a stock's price, but also to a gradual increase over time. Hence, it's not surprising that some companies are known for routinely beating earning projections. A negative earnings surprise will usually result in a decline in share price.

Next Day Price Change (%)

Next Regular trading session Closing price following Earnings result.

For After Market Close Earnings, It is a next trading day closing price. For Before Market Open Earnings, It is the same trading day closing price.

Why is it Important?

Next Day price change is a reaction of Earnings result.

This is Why Big Money is Investing in Small-Cap ETFs

Posted on Jun 30, 2026 by Ian Cooper

This is Why Big Money is Investing in Small-Cap ETFs

Big bets are being placed on small-cap ETFs and stocks, and for good reason. Investors are becoming increasingly optimistic that the U.S. economy will remain resilient despite ongoing uncertainty. 

When the economy is growing, consumers tend to spend more, businesses invest more, and smaller companies often benefit the most because they are closely tied to domestic economic activity. That optimism has translated into a solid performance for the Russell 2000 Index—widely considered the benchmark for U.S. small-cap stocks. In fact, the index just posted its strongest first-half gain since 1991. 

Many of these companies also stand to benefit from the expanding artificial intelligence boom. While large tech firms continue to lead AI development, smaller companies are increasingly supplying the software, equipment, manufacturing capabilities, and infrastructure needed to support the industry. As the AI investment story broadens, small-cap stocks are emerging as an attractive way for investors to participate in the next phase of market growth.

So, what’s the best way to participate in further rallies?

One way is by investing in exchange-traded funds (ETFs), such as:

Why Consider the iShares Russell 2000 ETF?


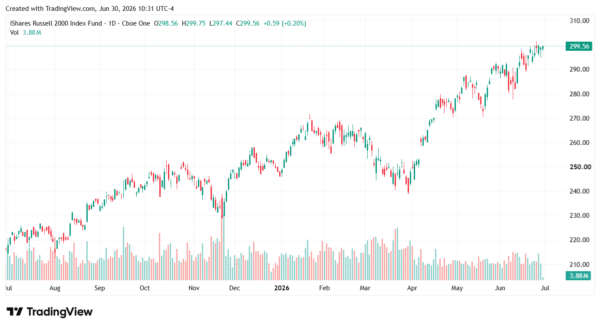
With a low expense ratio of just 0.19%, the iShares Russell 2000 ETF (NYSEARCA: IWM) provides investors with broad exposure to the U.S. small-cap market. The fund holds approximately 2,000 small-cap companies across a wide range of industries, offering diversification while capturing the growth potential of emerging businesses. Some of its notable holdings include Super Micro Computer (NASDAQ: SMCI), MicroStrategy (NASDAQ: STRK), Carvana (NYSE: CVNA), and Comfort Systems (NYSE: FIX).

The ETF tracks the Russell 2000 Index, one of the most widely followed benchmarks for U.S. small-cap stocks. Because it invests in a large number of companies rather than a handful of individual names, IWM reduces company-specific risk while giving investors access to businesses that are often in the earlier stages of their growth. Small-cap companies have historically outperformed large-cap stocks over certain long-term periods, particularly during the early stages of economic expansions.

Since the start of the year, the IWM ETF rallied from about $246.60 to a recent high of $299.16.

small-cap etf-StockEarnings

Why Consider the iShares Core S&P Small-Cap ETF?

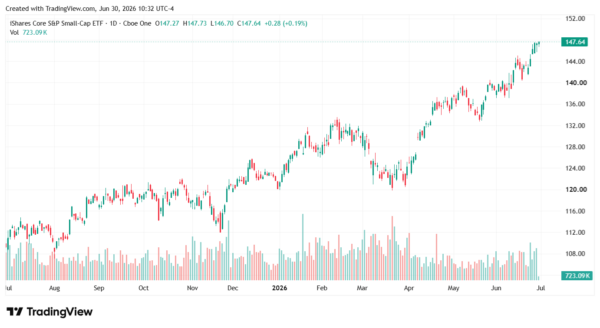
Another option to consider is the iShares Core S&P Small-Cap ETF (NYSEARCA: IJR). With a low expense ratio of just 0.06%, this ETF provides broad exposure to small-cap companies across a variety of industries. Some of its top holdings include Abercrombie & Fitch, Fabrinet, SM Energy, and Ensign Group, offering investors diversified access to the small-cap segment of the U.S. market. One of the key advantages of investing in IJR is its diversification. Rather than relying on the success of a single small-cap company, investors gain exposure to hundreds of businesses with varying growth opportunities and industry exposure. 

The fund tracks the S&P Small Cap 600 Index, which includes companies that generally meet certain financial viability standards before being added to the index. As a result, IJR provides investors with a cost-effective way to participate in the small-cap market while avoiding the challenge of researching and selecting individual companies.

Since the start of the year, the ETF ran from $120.10 to a high of $147.54.

small-cap etf-StockEarnings

Which Small-Cap ETF Is Right for You?

While small-cap stocks can be more volatile than their large-cap counterparts, the current market environment is creating opportunities that many investors don’t want to ignore. A strengthening economy, continued investment in artificial intelligence, and improving investor sentiment are all helping fuel renewed interest in smaller companies.

Rather than trying to identify the next breakout stock, ETFs such as IWM and IJR offer a simple, low-cost way to gain broad exposure to the sector while reducing the risks associated with owning individual stocks.

Over the last 26 years, he’s taught thousands of investors how to trade news flow and herd mentality using a unique blend of technical and fundamental analysis. Cooper was among the few analysts to spot the financial crisis of 2008, the top of subprime and Alt-A, the death of Lehman Brothers, Bear Stearns, and New Century Financial, and even the Dow’s collapse to 6,500, as well as its recovery. He even called for gold to rally well above $1.500 when it traded under $600. At the moment, Cooper makes use of technical, fundamental and news analysis, to help individual investors grow their wealth. He’s a firm believer that hard work and thorough research will lead to investment success.

Join over 1.2M+ investors/traders who receive daily and weekly notable earnings alerts with predicted move