ajax loader

Loading...


Ride-the-Wave Strategy – Best for Stock Traders

Ride-the-Wave targets multi-day price momentum following a company’s earnings announcement (EA). With this strategy:

  1. Buy a stock one day post-EA if a stock reacts positively post-earnings:
    1. Near the close of trading the EA-day for a pre-market-EA
    2. Near the close of the following day for a post-market-EA
  2. Sell-to-close after 7-10 days, or possibly earlier if a desired price target is reached

Similarly,

  1. short a stock one day post-EA if a stock reacts negatively post-earnings:
    1. near the close of trading the EA-day for a premarket-EA
    2. near the close of the following day for a post-market-EA
  2. then buy-to-close after 7-10 days, or possibly earlier if a desired price target is reached

Important: Ride-the-Wave is predicated on significant price momentum triggered by an EA. The 7-10 day scenario is the maximum trade hold-time. If you see post EA-momentum is halted or reversed by a significant opposite move, re-evaluate your presence in the trade.

This popular StockEarnings screen below will give you a list of stocks that historically exhibit significant price momentum following an EA for the next seven days:

  1. Stocks exhibiting positive post-EA price moves are buy-candidates
  2. Stocks exhibiting negative post-EA price moves are sell/short-candidates

The screen includes those stocks whose Earnings just came out in last two days.

Screen criteria:

  1. Earnings Date Start Date : Current Date + -1 Day
  2. Earnings Date End Date : Current Date + -2 Days
  3. Predicted Move (Next Day) Max : 7%
  4. Predicted Move (On 7th Day) Min : 7%

Strategy Guideline:

  1. Buy the stock if stock has reacted positively. Short the stock if stock has reacted negatively (see above).
  2. Close the position in 7-10 days, or possibly earlier based on price move.

Volatility Crush Strategy - Best for Options Traders

The Volatility Crush strategy is used with stocks that typically experience relatively low-to-moderate price moves (≤4%) following their Earnings Announcements (EA). The basic trade idea is to sell put or call options right before the EA, collecting a credit when options premium is very high due to elevated implied volatility (IV). You then close the position right after the EA by buying the option back much cheaper due to the significant drop in IV that occurs after the mystery of the EA disappears. In assessing this trade, you need to do your homework to ensure you collect sufficient premium to make the trade worthwhile.

This trade is practical due to the low-to-moderate price-move after the EA, which generally won’t significantly affect the options price, unlike an “action” stock, which experience great price moves post-EA. With these symbols, if you’re on the right side of the price move, that’s a great thing. But if you’re on the wrong side of the move, not so great. Consequently, by minimizing the effect of the post-EA price move, you have a much better chance to profit from the reduction in IV without it being ruined by a violent price move.

For this trade, open the position either (1) the night before the EA when the company announces earnings or (2) during the EA day when it announces post-market, generally capturing IV at or close to its peak.

For this trade, open the position either (1) the night before the EA when the company announces earnings or (2) during the EA day when it announces post-market, generally capturing IV at or close to its peak.

This popular stockearnings screen will give you a list of stocks which do not react more than 4% fpost-EA. It includes only those stocks whose earnings are releasing next day.

Screen criteria:

  1. Earnings Date Start Date : Current Date + 1
  2. Earnings Date End Date : Current Date + 1
  3. Predicted Move (Next Day) Max : 4%
  4. Options Type: Weekly

Strategy Guideline:

  1. Options Strategy: Sell Call and Put
  2. Options Strike Price: Current Stock Price – (% Predicated Move x 2)
  3. Expiration Date: It should generally be the closest expiry immediately after the EA.
  4. Buy Insurance: Buying back Call and Put at Strike price which 10% lower than Sell Strike Price is optional but recommended.

Watch Video for More Detail

Volatility Rush Strategy - Best for Options Traders

The Volatility Rush takes advantage of increasing options premiums into earnings announcements (EA) caused by an anticipated rise in Implied Volatility (IV). With this strategy, Buy a Call and Put at-the-money (a long straddle) 2-3 weeks before the EA when IV is lower. Sell the position either (1) the night before the EA when the company announces earnings pre-market, or (2) during the EA day when it announces post-market, generally capturing IV at or close to its peak.

This popular screen will give you a list of stocks whose Options premiums tend to rise into Earnings. It includes only those stocks whose Earnings are at least two weeks away from today.

Screen criteria:

  1. Earnings Date Start Date : Current Date + 15 Days
  2. Earnings Date End Date : Current Date + 30 Days
  3. Predicted Move (Next Day) Min : 5%
  4. Options Type: Weekly or Monthly if that lines up with the two to three-week lead-time for entering the trade

Strategy Guideline:

  1. Buy a Straddle at or close to the money two to three weeks pre-EA.
  2. Sell the position either the night before the EA when the company announces earnings pre-market, or during the EA day when it announces post-market.
  3. Expiration date should generally be the closest expiry immediately after the EA.
  4. Straddle price should not be more 60% of predicted move.

Predicted Move (Volatility)

Similar to Implied Volatility in Options. Expected volatility % based on our Proprietary Volatility Predication Model. We are expecting that stock price will likely to reach % in either direction by the end of next trading session after Earnings are released and not necessarily the closing volatility %.

Why is it important?

    This indicator helps

  1. Knowing expected volatility in stocks after Earnings helps to decide trading stocks before Earnings Announcement.
  2. Taking Advantage of volatility collapse following Earnings Results by using Advance Options strategies such as Spread and Straddles.

Since Last Earnings

Change in share price since last Earnings release.

Why is it Important?

When share has gained more than 10% since it's last Earning release, it tends to over react to minor bad news and give up some gains if not all. So, it contains more downside volatility than upside When share has dropped more than 10% since it's last Earning release, it tends to over react to minor good news and recover some drops if not all. So, it contains more upside volatility than downside.

EPS Surprise (%)

Occurs when a company's reported quarterly or annual profits are above or below analysts' expectations. Here is the formula to derive % EPS Surprice:

Actual EPS - Estimated EPS
------------------------------------- x 100
Estimated EPS

Why is it Important?

Earnings surprises can have a huge impact on a company's stock price. Several studies suggest that positive earnings surprises not only lead to an immediate hike in a stock's price, but also to a gradual increase over time. Hence, it's not surprising that some companies are known for routinely beating earning projections. A negative earnings surprise will usually result in a decline in share price.

Next Day Price Change (%)

Next Regular trading session Closing price following Earnings result.

For After Market Close Earnings, It is a next trading day closing price. For Before Market Open Earnings, It is the same trading day closing price.

Why is it Important?

Next Day price change is a reaction of Earnings result.

Southwest Airlines Stock Sinks Despite EPS Beat: Here’s the Catch

Posted on Jul 24, 2026 by Chris Markoch

Southwest Airlines Stock Sinks Despite EPS Beat: Here’s the Catch

Southwest Airlines (NYSE: LUV) fell more than 6% the day after it reported its Q2 2026 earnings. Revenue of $8.43 billion came in short of expectations for $8.58 billion. However, adjusted earnings per share (EPS) of 94 cents beat analysts’ forecast of 52 cents. 

To be fair, revenue was up 16.4% year over year. This isn’t an airline in trouble. However, the company guided for slower growth for the remainder of the year.  

In the upcoming third quarter, Southwest guided for adjusted EPS between 50 cents and 75 cents. That’s below the estimate of 82 cents per share. For the full year, the airline is guiding for adjusted EPS in the range of $3.25 to $4.25 per share, slightly higher on the low end than the estimate of $3.17.  
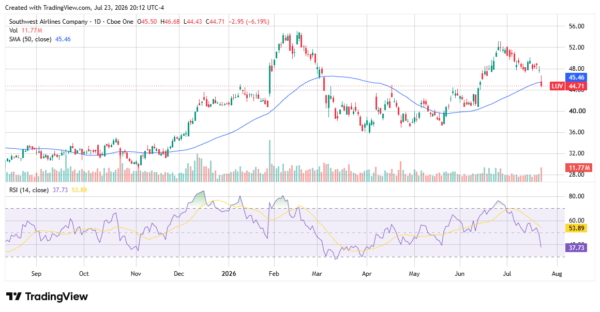
southwest - StockEarnings

The Guidance Cut Hiding Behind the Headline 


Southwest titled its own press release “Earnings Power on Full Display.” That’s the kind of framing that should make investors pause. Buried beneath the celebratory language is a meaningful guidance cut. Just one quarter ago, Southwest was telling investors to expect full-year adjusted EPS of “at least $4.00.” Now the company says $3.25 to $4.25 — a range whose low end sits a full 75 cents below what management was promising in the spring. 

Management will point out that the high end of the new range is still above $4.00, and that’s technically true. But when a company widens its guidance range downward rather than narrowing it as the year progresses, that’s usually a tell. It suggests less visibility into the back half, not more. A company genuinely on top of its earnings power narrows its range as certainty increases. It doesn’t stretch the floor lower. 

The capacity story tells a similar tale. Southwest now expects full-year capacity growth of approximately 1.5%, down from its prior guidance of 2%. It’s a small trim, but it’s a trim nonetheless, and it arrives at the same moment management is touting “broad demand strength.” 

Buybacks Are Doing More Work Than the Business 

Here’s the number that should catch a skeptical reader’s eye: net income of $233 million was up just 9.4% year-over-year, but diluted EPS of 47 cents was up 20.5%. How does a company grow its per-share earnings more than twice as fast as its actual profit? Fewer shares.  

Weighted average diluted shares outstanding fell from 541 million to 493 million. That’s a nearly 9% reduction, the product of aggressive buybacks funded in part by drawing down the cash pile built during the pandemic-era capital raises. 

There’s nothing wrong with buybacks. But when a huge share of your “earnings power” story is actually a “shrinking denominator” story, that’s worth saying out loud. Southwest still has $450 million left on its repurchase authorization, so expect this lever to keep getting pulled through year-end. That’s a convenient way to keep EPS headlines looking better than organic profit growth would justify on its own. 

It’s also worth noting that the reported revenue miss wasn’t purely a demand problem. Southwest revised its estimate of how many older flight credits customers will actually redeem, which forced a $285 million downward adjustment to revenue that’s excluded from the adjusted numbers. Strip that out, and adjusted revenue was actually up 20.3%.  

The revenue “miss” is partly an accounting quirk rather than a pure demand shortfall. But it also means the headline growth investors are cheering leans on a number that isn’t quite as clean as it looks, either way you slice it. 

A Cloudy Outlook Leans Toward Turbulence for LUV 

The stock market is not the economy. But if you pay attention, certain companies serve as a better proxy for the consumer than others. Southwest is a low-cost airline that has developed a loyal customer base. The concern is that a high percentage of those customers are in the lower leg of the K-shaped economy.  

As investors have heard from other companies like McDonald’s (NYSE: MCD)Walmart (NASDAQ: WMT) and General Mills (NYSE: GIS), those consumers are being more choiceful. And when you hear from Albertson’s (NYSE: ACI) that consumers are cutting back on grocery spending…you can connect the dots.  

Southwest can’t be accused of pessimism. But even with discounted fares, it comes down to believing a forecast or your lying eyes. Many consumers aren’t taking vacations this year. Many that do aren’t flying. That’s a headwind.  

Oil prices are above $90 per barrel as I write this. It’s likely to be higher before it goes lower. Southwest’s own numbers back this up — fuel expense jumped $889 million year-over-year in the quarter, with cost per gallon up nearly 70% from a year ago. That will have a direct impact on Southwest’s bottom line. 

Southwest - StockEarnings

Airlines in general have irregular and lumpy free cash flow. Southwest is no different. Therefore, earnings growth is perhaps the best metric to gauge its fair value.  

If Southwest’s forecast is right, investors can expect strong earnings growth in the second half of the year. It generated $1.39 in adjusted EPS through the first two quarters. To hit the low end of its guidance, it would require over 100% EPS growth.  

But hitting that number seems to assume a lot of things are going to go right. Geopolitical risks to oil and macroeconomic risks to the consumer at large suggest that not everything will go right.  

For all those reasons, you might want to take a vacation from LUV stock. At the very least, let the current selloff run its course, then re-evaluate. By Labor Day, there may be more clarity on jet fuel prices and holiday travel demand. Without that, LUV offers unquantifiable risk for a reward that doesn’t look that enticing.  

A former marketing copywriter turned freelance financial writer and market analyst. I have a passion for delivering insights to investors. I write regularly about stocks for StockEarnings and MarketBeat. Posts are not advice.

Join over 1.2M+ investors/traders who receive daily and weekly notable earnings alerts with predicted move
