When it comes to hot semiconductor names, Qualcomm (NASDAQ: QCOM) really hasn’t been discussed that much relative to the heavy-hitters. However, from a quantitative trading perspective, that makes QCOM stock attractive, presenting a sleeper opportunity. Even better, there’s empirical evidence to suggest that certain QCOM options spreads are mispriced — in your favor.
Technically, those who look at the chart for Qualcomm stock will likely be tempted by the mean-reversion argument. As you know, Qualcomm is a major player in global communications and computing, including next-generation mobile networks, smart devices and semiconductors. Because of this robust business, its near-term volatility may be viewed as a discount.
Most notably, in the trailing month, QCOM stock has slipped nearly 21%. At its peak this year, shares were trading hands at just above $251. Unfortunately, with the volatility, the year-to-date performance is now a very pedestrian 1.43%. My hypothesis is that this circumstance may change for the better over the next several weeks.
Fundamentally, a potential upside catalyst for QCOM stock is the upcoming second-quarter earnings report. Scheduled for release on July 29, analysts are anticipating earnings per share of $2.09 on revenue of $9.67 billion. In recent quarters, Qualcomm has put up strong numbers so the assumption is that the trend will continue.
Taking a Peek at the Volatility Skew for QCOM Stock
Of course, I don’t know what may happen. What I can say is that, just ahead of the disclosure — that is, for the options chain expiring July 24 — the volatility skew shows a bullish-leaning “smile.” Here, smart money traders are paying a premium for out-the-money (OTM) puts, thus implementing downside protection. However, the skew is clearly biased toward the right side (or call side) of the chart.
What does that mean? If I’m interpreting the data correctly, it would suggest that the main priority is upside convexity. In other words, the smart money recognizes the risk that Qualcomm stock could tumble if sentiment is disappointing. However, the skew suggests that traders don’t want to be caught unawares if QCOM decides to rip higher.
What’s really interesting is the volatility skew for the week after (expiring July 31). In this case, the chart is relatively flat across the strike price spectrum, with the exception of a massive spike for calls between the $260 and $270 strikes. Overall, it does seem as if the market is broadly optimistic about Qualcomm delivering the goods.
Does that translate to a higher probability of an earnings beat? No, I don’t think you can deduce that from the skew alone, which merely shows the risk-reward positioning of sophisticated market participants. That said, it’s not unreasonable to view QCOM stock as a glass-half-full situation, as professional traders simply have access to better information.
Order Flow Balance a Possible Driver for Qualcomm Stock
Honestly, though, trying to play the earnings game is an incredibly difficult task. It’s like the knockout games of the World Cup. All it takes is a bad call by the ref, a genuinely unlucky moment or just a quick lapse of concentration and years of hard work can go down the drain.
Some might love the pressure. I view it like England must view penalty shoot-outs.
For me, I’d much rather focus on the mechanics of market movements and transitions. In modern equity markets, algorithmic, rules-based protocols dominate the underlying transactions. Essentially, there are two ways to play stocks: the response space and the prediction space. In the former category, whoever is first wins. As such, there’s a clear financial incentive to use machines, which are infinitely faster than humans.
Of course, I contend that retail traders cannot play the response game. Our computers are too slow, we can’t read and act fast enough and we’re always downstream of the information distribution cycle. So, when an “alert” pops up, it’s practically guaranteed that the algos have beat you to the punch. You can buy but you’re often doing so at a peak premium to volatility.
This raises an obvious question: how can retail traders play in the prediction space? Fundamentally, it’s because nobody knows what the future will hold. Second, because trading is dominated by the algos, they leave structural footprints. In particular, when quality names like QCOM stock suffer extended bearishness, the machines may view the ticker as a temporary discount.
If that’s the case — which I genuinely believe it is — then we should historically see changes in expected performance when Qualcomm stock encounters prolonged downturns.
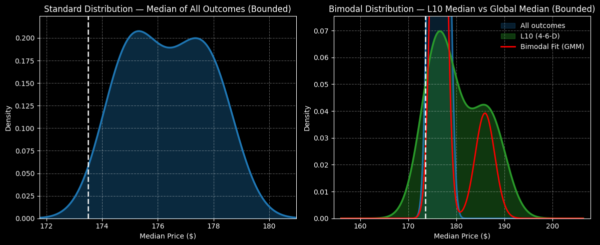
Right now, QCOM stock is on pace to print four up weeks in the last 10 weeks, thus potentially leading to a downward slope across the period. But the interesting element here is the signal’s implied distribution of future outcomes. This 4-6-D quantitative sequence has flashed 54 times on a rolling basis since January 2019. Upon doing so, over the next 10 weeks, QCOM would be expected to range between $165 and $198.
In contrast, the forward 10-week distribution under random conditions is between $172 and $181. Yes, the risk curvature does expand under 4-6-D conditions; however, the net bias is toward the upside.
Selecting a Mispriced Idea
While the performance of Qualcomm stock is generally expected to improve based on historical precedent, the outlook isn’t anticipated to be orderly and linear. Indeed, the bulk of upside may come near the tail end of the distribution.
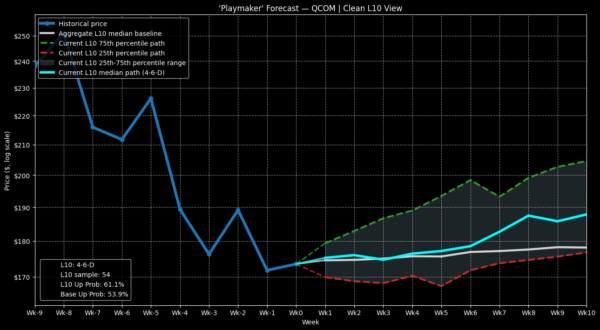
At the end of week 9 following the flashing of the 4-6-D signal, the median expected outcome for QCOM stock is around $187. Further, the 75th median percentile path is forecasted to reach $202, while the 25th median percentile path is around $177.
Based on this data, I’m tempted by the 180/190 bull call spread expiring Sep. 18. What makes this trade stand out is the breakeven price of $184.85. Right now, the market assigns a probability of profit (or the chance that Qualcomm stock will rise to the breakeven price) of 40.8% Because the maximum payout of this trade is just above 106%, a 40.8% probability of profit would easily lead to a negative expected value.
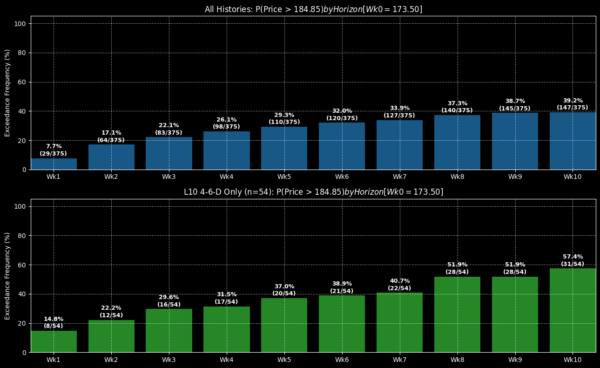
However, the above probability is a theoretical one, generated by running QCOM’s IV through the Black-Scholes formula, which assumes a risk-neutral, lognormal environment. However, my hypothesis states that market transitions are not risk-neutral but risk-dependent. That’s why I’m coming up with different numbers.
Of the 54 times that the 4-6-D signal has flashed, QCOM stock has exceeded the equivalent of the $184.85 breakeven price a total of 28 times on week 9 (Sept. 18). Subsequently, it’s possible that the empirically observed probability of profit is 51.9%. In a way, you’d be getting a thousand basis points of free odds in your favor.

