ajax loader

Loading...


Ride-the-Wave Strategy – Best for Stock Traders

Ride-the-Wave targets multi-day price momentum following a company’s earnings announcement (EA). With this strategy:

  1. Buy a stock one day post-EA if a stock reacts positively post-earnings:
    1. Near the close of trading the EA-day for a pre-market-EA
    2. Near the close of the following day for a post-market-EA
  2. Sell-to-close after 7-10 days, or possibly earlier if a desired price target is reached

Similarly,

  1. short a stock one day post-EA if a stock reacts negatively post-earnings:
    1. near the close of trading the EA-day for a premarket-EA
    2. near the close of the following day for a post-market-EA
  2. then buy-to-close after 7-10 days, or possibly earlier if a desired price target is reached

Important: Ride-the-Wave is predicated on significant price momentum triggered by an EA. The 7-10 day scenario is the maximum trade hold-time. If you see post EA-momentum is halted or reversed by a significant opposite move, re-evaluate your presence in the trade.

This popular StockEarnings screen below will give you a list of stocks that historically exhibit significant price momentum following an EA for the next seven days:

  1. Stocks exhibiting positive post-EA price moves are buy-candidates
  2. Stocks exhibiting negative post-EA price moves are sell/short-candidates

The screen includes those stocks whose Earnings just came out in last two days.

Screen criteria:

  1. Earnings Date Start Date : Current Date + -1 Day
  2. Earnings Date End Date : Current Date + -2 Days
  3. Predicted Move (Next Day) Max : 7%
  4. Predicted Move (On 7th Day) Min : 7%

Strategy Guideline:

  1. Buy the stock if stock has reacted positively. Short the stock if stock has reacted negatively (see above).
  2. Close the position in 7-10 days, or possibly earlier based on price move.

Volatility Crush Strategy - Best for Options Traders

The Volatility Crush strategy is used with stocks that typically experience relatively low-to-moderate price moves (≤4%) following their Earnings Announcements (EA). The basic trade idea is to sell put or call options right before the EA, collecting a credit when options premium is very high due to elevated implied volatility (IV). You then close the position right after the EA by buying the option back much cheaper due to the significant drop in IV that occurs after the mystery of the EA disappears. In assessing this trade, you need to do your homework to ensure you collect sufficient premium to make the trade worthwhile.

This trade is practical due to the low-to-moderate price-move after the EA, which generally won’t significantly affect the options price, unlike an “action” stock, which experience great price moves post-EA. With these symbols, if you’re on the right side of the price move, that’s a great thing. But if you’re on the wrong side of the move, not so great. Consequently, by minimizing the effect of the post-EA price move, you have a much better chance to profit from the reduction in IV without it being ruined by a violent price move.

For this trade, open the position either (1) the night before the EA when the company announces earnings or (2) during the EA day when it announces post-market, generally capturing IV at or close to its peak.

For this trade, open the position either (1) the night before the EA when the company announces earnings or (2) during the EA day when it announces post-market, generally capturing IV at or close to its peak.

This popular stockearnings screen will give you a list of stocks which do not react more than 4% fpost-EA. It includes only those stocks whose earnings are releasing next day.

Screen criteria:

  1. Earnings Date Start Date : Current Date + 1
  2. Earnings Date End Date : Current Date + 1
  3. Predicted Move (Next Day) Max : 4%
  4. Options Type: Weekly

Strategy Guideline:

  1. Options Strategy: Sell Call and Put
  2. Options Strike Price: Current Stock Price – (% Predicated Move x 2)
  3. Expiration Date: It should generally be the closest expiry immediately after the EA.
  4. Buy Insurance: Buying back Call and Put at Strike price which 10% lower than Sell Strike Price is optional but recommended.

Watch Video for More Detail

Volatility Rush Strategy - Best for Options Traders

The Volatility Rush takes advantage of increasing options premiums into earnings announcements (EA) caused by an anticipated rise in Implied Volatility (IV). With this strategy, Buy a Call and Put at-the-money (a long straddle) 2-3 weeks before the EA when IV is lower. Sell the position either (1) the night before the EA when the company announces earnings pre-market, or (2) during the EA day when it announces post-market, generally capturing IV at or close to its peak.

This popular screen will give you a list of stocks whose Options premiums tend to rise into Earnings. It includes only those stocks whose Earnings are at least two weeks away from today.

Screen criteria:

  1. Earnings Date Start Date : Current Date + 15 Days
  2. Earnings Date End Date : Current Date + 30 Days
  3. Predicted Move (Next Day) Min : 5%
  4. Options Type: Weekly or Monthly if that lines up with the two to three-week lead-time for entering the trade

Strategy Guideline:

  1. Buy a Straddle at or close to the money two to three weeks pre-EA.
  2. Sell the position either the night before the EA when the company announces earnings pre-market, or during the EA day when it announces post-market.
  3. Expiration date should generally be the closest expiry immediately after the EA.
  4. Straddle price should not be more 60% of predicted move.

Predicted Move (Volatility)

Similar to Implied Volatility in Options. Expected volatility % based on our Proprietary Volatility Predication Model. We are expecting that stock price will likely to reach % in either direction by the end of next trading session after Earnings are released and not necessarily the closing volatility %.

Why is it important?

    This indicator helps

  1. Knowing expected volatility in stocks after Earnings helps to decide trading stocks before Earnings Announcement.
  2. Taking Advantage of volatility collapse following Earnings Results by using Advance Options strategies such as Spread and Straddles.

Since Last Earnings

Change in share price since last Earnings release.

Why is it Important?

When share has gained more than 10% since it's last Earning release, it tends to over react to minor bad news and give up some gains if not all. So, it contains more downside volatility than upside When share has dropped more than 10% since it's last Earning release, it tends to over react to minor good news and recover some drops if not all. So, it contains more upside volatility than downside.

EPS Surprise (%)

Occurs when a company's reported quarterly or annual profits are above or below analysts' expectations. Here is the formula to derive % EPS Surprice:

Actual EPS - Estimated EPS
------------------------------------- x 100
Estimated EPS

Why is it Important?

Earnings surprises can have a huge impact on a company's stock price. Several studies suggest that positive earnings surprises not only lead to an immediate hike in a stock's price, but also to a gradual increase over time. Hence, it's not surprising that some companies are known for routinely beating earning projections. A negative earnings surprise will usually result in a decline in share price.

Next Day Price Change (%)

Next Regular trading session Closing price following Earnings result.

For After Market Close Earnings, It is a next trading day closing price. For Before Market Open Earnings, It is the same trading day closing price.

Why is it Important?

Next Day price change is a reaction of Earnings result.

Northrop Grumman’s Aggressive Strategy Targets A Massive Defense Supercycle

Posted on Jul 23, 2026 by Grayson Cavern

Northrop Grumman’s Aggressive Strategy Targets A Massive Defense Supercycle

Northrop Grumman Corp (NYSE: NOC) second-quarter earnings looked contradictory on the surface, and I understand why the market is struggling to read them cleanly.

Revenue rose 5% to $10.9 billion, operating margin compressed to 10.1% from 13.8%, diluted EPS slipped 6% to $7.68, and yet management raised full-year sales guidance by $250 million, lifted MTM-adjusted EPS guidance by $1.20, reaffirmed adjusted free cash flow, and celebrated a record $104.7 billion backlog in the same breath.

Companies facing structural margin deterioration rarely become more confident about the year ahead while continuing to invest aggressively in the business. The quarter suggests Northrop is prioritizing execution against future demand over maximizing near-term profitability.

The Backlog Is The Business Now


The headline figure this quarter was backlog, and anyone who led with EPS was reading the wrong number.

Net awards reached $20 billion during the quarter alone, pushing total backlog to a record $104.7 billion. The composition of those awards matters as much as the size; $7.6 billion for Sentinel, $4.3 billion of restricted programs, $1.0 billion for F-35 work, $800 million for Glide Phase Interceptor, and $700 million for the MESA program. These are multi-year commitments from a defense establishment that is relearning, in real time, what it means to face serious peer competition simultaneously in multiple theaters.

Management’s presentation reinforced the same message. Rather than defending quarterly profitability, it kept highlighting accelerating momentum, expanding production capacity, new multi-year missile agreements, and sustained global demand. The company also committed to keeping capital spending around 4.5% of sales through 2027 and 2028 to support that growth. 

Bottomline is, the management now sees more demand than it currently has the capacity to serve, and is spending to close that gap before someone else does.

Margin Pressure Is Following Investment

The segment results put the headline margin compression into better context. Rather than appearing across the business, it was concentrated in the segments where Northrop is investing most heavily to support future production.

Aeronautics Systems delivered one of its strongest quarters in recent years. Sales increased 13% as production expanded across the B-21, TACAMO, B-2, and F-35 programs. Operating income also rose 13%, while margins held steady at 10.3%, indicating the business continues to execute despite a broader environment of rising investment.

Mission Systems produced a similarly solid quarter. Revenue increased 3%, operating income climbed 14%, and operating margin expanded to 15.4% from 14.0%, supported by stronger program execution and favorable estimate adjustments. Together, those results suggest the company’s margin pressure isn’t broad-based.

Instead, it is concentrated in Defense Systems and Space Systems… the two segments absorbing much of Northrop Grumman Corp’s (NYSE: NOC)  current production expansion.

Defense Systems reported a 38% decline in operating income as margins compressed to 7.5% from 12.7%. The results included a $68 million unfavorable estimate adjustment on the Stand-in Attack Weapon program, while the business continued investing in tactical missile production and supporting the Sentinel ramp.

Space Systems experienced a similar pattern. Operating margin declined to 8.6% from 10.6%, reflecting a $91 million unfavorable estimate adjustment on the GEM 63XL rocket motor program. Management said its root-cause investigation has progressed and continues to expect second-half margins above 11%.

Viewed together, the segment results point less toward weakening demand than toward the cost of executing against an expanding portfolio of long-duration defense programs. That’s consistent with the broader message management delivered throughout the quarter that near-term profitability is absorbing the cost of building capacity for a substantially larger order book. 

Cash Flow Tells A More Honest Story Than The EPS Did

Reported EPS also deserves some context before it gets used as the bear case. Last year’s second quarter included a $231 million gain from the sale of the training services business, worth roughly $1.04 per share. Strip that out and the operational comparison narrows significantly, which management illustrated clearly in its earnings bridge, though most of the coverage I’ve seen didn’t bother to make that adjustment.

Cash generation was stronger than the headline suggested. Operating cash flow increased 47% to $1.28 billion, while adjusted free cash flow jumped 54% to $978 million despite higher capital expenditures. The lower effective tax rate, falling to 6.3% from 17.7% following developments with previously filed IRS tax matters, also supported the underlying earnings picture. Viewed through the cash lens rather than the reported EPS lens, this quarter looks far less like deteriorating profitability and far more like a company funding expansion while maintaining genuinely healthy cash generation underneath it.

Can This Investment Fund The Next Decades Of Growth?

Shares remain below the declining 20-, 50-, and 200-day moving averages following a sharp correction from the March highs, showing the market hasn’t fully embraced the improving demand outlook yet. At the same time, the stock has repeatedly found support near $500, and the post-earnings rebound arrived on stronger volume, which tells you buyers are showing up at that level with conviction rather than indifference.

A sustained move back above the 50-day moving average would signal that investors are beginning to price Northrop’s accelerating backlog rather than fixating on temporary margin compression. That move hasn’t happened yet. I think it eventually will, because the record backlog, expanding production commitments, and raised guidance are all pointing toward the same conclusion that this company is willingly sacrificing near-term margins to ensure it has the industrial capacity to serve what it believes will be a structurally larger defense market over the next several years.

If that demand materializes – and a $104.7 billion backlog suggests a meaningful portion of it already has – today’s margin pressure won’t be remembered as a warning sign. It’ll be remembered as the investment that funded the next decade of earnings growth.
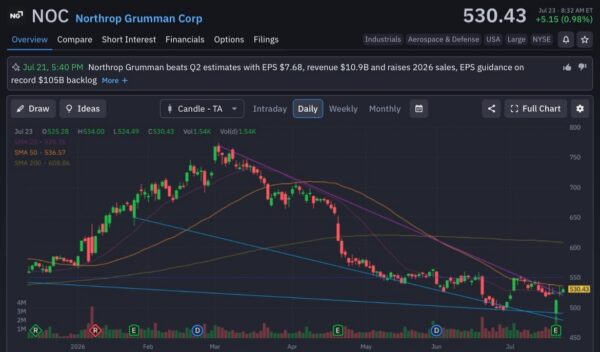
Northrop Grumman-Stock Earnings

Join over 1.2M+ investors/traders who receive daily and weekly notable earnings alerts with predicted move
