ajax loader

Loading...


Ride-the-Wave Strategy – Best for Stock Traders

Ride-the-Wave targets multi-day price momentum following a company’s earnings announcement (EA). With this strategy:

  1. Buy a stock one day post-EA if a stock reacts positively post-earnings:
    1. Near the close of trading the EA-day for a pre-market-EA
    2. Near the close of the following day for a post-market-EA
  2. Sell-to-close after 7-10 days, or possibly earlier if a desired price target is reached

Similarly,

  1. short a stock one day post-EA if a stock reacts negatively post-earnings:
    1. near the close of trading the EA-day for a premarket-EA
    2. near the close of the following day for a post-market-EA
  2. then buy-to-close after 7-10 days, or possibly earlier if a desired price target is reached

Important: Ride-the-Wave is predicated on significant price momentum triggered by an EA. The 7-10 day scenario is the maximum trade hold-time. If you see post EA-momentum is halted or reversed by a significant opposite move, re-evaluate your presence in the trade.

This popular StockEarnings screen below will give you a list of stocks that historically exhibit significant price momentum following an EA for the next seven days:

  1. Stocks exhibiting positive post-EA price moves are buy-candidates
  2. Stocks exhibiting negative post-EA price moves are sell/short-candidates

The screen includes those stocks whose Earnings just came out in last two days.

Screen criteria:

  1. Earnings Date Start Date : Current Date + -1 Day
  2. Earnings Date End Date : Current Date + -2 Days
  3. Predicted Move (Next Day) Max : 7%
  4. Predicted Move (On 7th Day) Min : 7%

Strategy Guideline:

  1. Buy the stock if stock has reacted positively. Short the stock if stock has reacted negatively (see above).
  2. Close the position in 7-10 days, or possibly earlier based on price move.

Volatility Crush Strategy - Best for Options Traders

The Volatility Crush strategy is used with stocks that typically experience relatively low-to-moderate price moves (≤4%) following their Earnings Announcements (EA). The basic trade idea is to sell put or call options right before the EA, collecting a credit when options premium is very high due to elevated implied volatility (IV). You then close the position right after the EA by buying the option back much cheaper due to the significant drop in IV that occurs after the mystery of the EA disappears. In assessing this trade, you need to do your homework to ensure you collect sufficient premium to make the trade worthwhile.

This trade is practical due to the low-to-moderate price-move after the EA, which generally won’t significantly affect the options price, unlike an “action” stock, which experience great price moves post-EA. With these symbols, if you’re on the right side of the price move, that’s a great thing. But if you’re on the wrong side of the move, not so great. Consequently, by minimizing the effect of the post-EA price move, you have a much better chance to profit from the reduction in IV without it being ruined by a violent price move.

For this trade, open the position either (1) the night before the EA when the company announces earnings or (2) during the EA day when it announces post-market, generally capturing IV at or close to its peak.

For this trade, open the position either (1) the night before the EA when the company announces earnings or (2) during the EA day when it announces post-market, generally capturing IV at or close to its peak.

This popular stockearnings screen will give you a list of stocks which do not react more than 4% fpost-EA. It includes only those stocks whose earnings are releasing next day.

Screen criteria:

  1. Earnings Date Start Date : Current Date + 1
  2. Earnings Date End Date : Current Date + 1
  3. Predicted Move (Next Day) Max : 4%
  4. Options Type: Weekly

Strategy Guideline:

  1. Options Strategy: Sell Call and Put
  2. Options Strike Price: Current Stock Price – (% Predicated Move x 2)
  3. Expiration Date: It should generally be the closest expiry immediately after the EA.
  4. Buy Insurance: Buying back Call and Put at Strike price which 10% lower than Sell Strike Price is optional but recommended.

Watch Video for More Detail

Volatility Rush Strategy - Best for Options Traders

The Volatility Rush takes advantage of increasing options premiums into earnings announcements (EA) caused by an anticipated rise in Implied Volatility (IV). With this strategy, Buy a Call and Put at-the-money (a long straddle) 2-3 weeks before the EA when IV is lower. Sell the position either (1) the night before the EA when the company announces earnings pre-market, or (2) during the EA day when it announces post-market, generally capturing IV at or close to its peak.

This popular screen will give you a list of stocks whose Options premiums tend to rise into Earnings. It includes only those stocks whose Earnings are at least two weeks away from today.

Screen criteria:

  1. Earnings Date Start Date : Current Date + 15 Days
  2. Earnings Date End Date : Current Date + 30 Days
  3. Predicted Move (Next Day) Min : 5%
  4. Options Type: Weekly or Monthly if that lines up with the two to three-week lead-time for entering the trade

Strategy Guideline:

  1. Buy a Straddle at or close to the money two to three weeks pre-EA.
  2. Sell the position either the night before the EA when the company announces earnings pre-market, or during the EA day when it announces post-market.
  3. Expiration date should generally be the closest expiry immediately after the EA.
  4. Straddle price should not be more 60% of predicted move.

Predicted Move (Volatility)

Similar to Implied Volatility in Options. Expected volatility % based on our Proprietary Volatility Predication Model. We are expecting that stock price will likely to reach % in either direction by the end of next trading session after Earnings are released and not necessarily the closing volatility %.

Why is it important?

    This indicator helps

  1. Knowing expected volatility in stocks after Earnings helps to decide trading stocks before Earnings Announcement.
  2. Taking Advantage of volatility collapse following Earnings Results by using Advance Options strategies such as Spread and Straddles.

Since Last Earnings

Change in share price since last Earnings release.

Why is it Important?

When share has gained more than 10% since it's last Earning release, it tends to over react to minor bad news and give up some gains if not all. So, it contains more downside volatility than upside When share has dropped more than 10% since it's last Earning release, it tends to over react to minor good news and recover some drops if not all. So, it contains more upside volatility than downside.

EPS Surprise (%)

Occurs when a company's reported quarterly or annual profits are above or below analysts' expectations. Here is the formula to derive % EPS Surprice:

Actual EPS - Estimated EPS
------------------------------------- x 100
Estimated EPS

Why is it Important?

Earnings surprises can have a huge impact on a company's stock price. Several studies suggest that positive earnings surprises not only lead to an immediate hike in a stock's price, but also to a gradual increase over time. Hence, it's not surprising that some companies are known for routinely beating earning projections. A negative earnings surprise will usually result in a decline in share price.

Next Day Price Change (%)

Next Regular trading session Closing price following Earnings result.

For After Market Close Earnings, It is a next trading day closing price. For Before Market Open Earnings, It is the same trading day closing price.

Why is it Important?

Next Day price change is a reaction of Earnings result.

Morgan Stanley’s Trading Strength Fuels Wealth Management

Posted on Jul 23, 2026 by Grayson Cavern

Morgan Stanley’s Trading Strength Fuels Wealth Management

Morgan Stanley (NYSE: MS) reported Q2 earnings with record net revenues of $21.3 billion for Q2 2026, up 27% from $16.8 billion a year ago, with EPS climbing 62% to $3.46 from $2.13, ROTCE hitting 26.6% versus 18.2%, and pre-tax income surging 59% to $7.3 billion. 

The expense efficiency ratio dropped from 71% to 65%, meaning the firm extracted more revenue from every dollar of cost it ran through the business. On paper, this looks like a firm that simply had a great trading quarter with trading equity up 69% in a volatile market.

However, the more eye-opening story is just one layer deeper, and I think most investors are going to miss it entirely.

Equities Fed The Entire Machine.


Institutional Securities generated $11.0 billion in net revenues against $7.6 billion a year ago, with Equity revenues alone hitting $6.3 billion – up 69% from $3.7 billion – driven by record performance across businesses and regions, with particularly notable strength in Asia. Investment Banking contributed $2.4 billion, up 58% from $1.5 billion, powered by a surge in IPOs, follow-on offerings, convertibles, and M&A advisory activity concentrated in the Americas. Fixed Income added $2.5 billion, up 13%.

Most people will stop there and call this a trading story. After all, a combination of volatile market and elevated client activity means Morgan Stanley (NYSE:MS) wins. But that’s incomplete, because what happened inside Institutional Securities this quarter didn’t just stay inside Institutional Securities.

Wealth Management pulled in $148.1 billion in net new assets during the quarter, compared to $59.2 billion a year ago, a 2.5x increase that management didn’t fully headline but absolutely should have. The detail buried in the Q2 release is the one that changes everything: just over half of those inflows came from IPO-related activity through the Workplace channel. The investment banking machine underwriting deals on the institutional side directly manufactured asset inflows on the wealth management side, in the same quarter, with the same clients moving through both pipelines simultaneously.

Yes, this is Ted Pick’s Integrated Firm thesis producing actual, measurable results and it’s the story the headline EPS number obscures rather than reveals.

Wealth Management Hit $10 Trillion

Wealth Management generated $8.9 billion in revenues, up 14% from $7.8 billion, with a pre-tax margin of 30.5% and fee-based client assets reaching $3.0 trillion against $2.5 trillion a year ago. Total client assets across Wealth and Investment Management crossed the $10 trillion milestone this quarter, a number Ted Pick specifically highlighted in his opening remarks.

The composition of that $148 billion in net new assets matters as much as the size. Fee-based asset flows came in at $39.1 billion for the quarter, and net interest income increased to $2.3 billion from $1.9 billion as sweep deposits grew and the lending book kept compounding. Asset management revenues hit $5.3 billion against $4.4 billion a year ago. This is a business that actively converts institutional relationships into recurring wealth management revenue, and the connection between the two is becoming more structural with every passing quarter.

Investment Management contributed $1.6 billion in revenues, essentially flat, but AUM reached $2.0 trillion against $1.7 trillion, with $7.5 billion in long-term net flows. Steady, not spectacular, but exactly what you want from the segment that anchors the recurring revenue base.

The Chart Is Setting Up A Decision Point

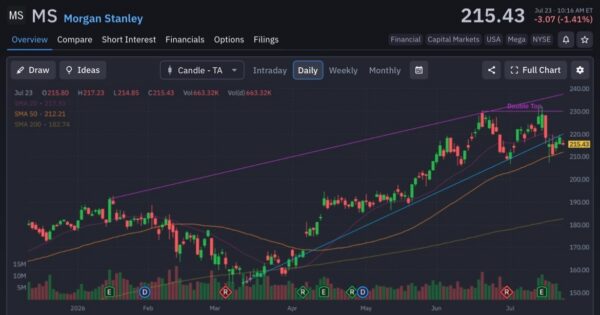
Morgan Stanley trades at $215.43 as of July 23, sitting between the 50-day moving average at $212.21 and the 20-day at $217.93, with the 200-day well below at $182.74, confirming the long-term uptrend remains structurally intact. 

The chart shows a double top formation that printed near $230 earlier in the year, followed by a controlled pullback that found support at the rising 50-day average, with today’s price attempting to hold just above it on volume of 663,320 shares. A relatively contained session given the magnitude of the earnings beat.

The double top is the honest part of this picture. It tells you the market tested $230 twice and couldn’t hold it, which means sellers were waiting at that level with enough conviction to establish real resistance. The question isn’t whether the fundamentals justify a higher price, the 62% EPS growth and the $10 trillion AUM milestone suggest they do. The question is whether the institutional buyers defending the 50-day are strong enough to absorb whatever supply comes from investors who bought the first top and are looking for their exit.
morgan stanley-StockEarnings

How I’m Thinking About This

This quarter convinced me that Morgan Stanley is becoming harder to analyze as a traditional investment bank.

The market still tends to judge the company through the lens of investment banking fees and trading revenue. Those businesses remain cyclical by nature. They depend on market activity, capital raising and client engagement.

What stood out this quarter is that those businesses are serving another purpose.

Institutional Securities is generating relationships that become Wealth Management assets. Those assets then produce recurring advisory fees, lending income and asset management revenue that compound long after the original transaction has closed. That’s a fundamentally different earnings model from simply producing another strong trading quarter.

To me, that’s the real significance of this earnings release.

The record revenue, record EPS and record profitability are impressive, but they’re outcomes, not the story itself. The story is that Morgan Stanley’s Integrated Firm strategy is no longer an aspiration management discusses on conference calls. It’s beginning to show up in the numbers.

That’s what makes this quarter important. Exceptional trading environments come and go. Businesses that consistently convert transactional relationships into recurring assets tend to become more valuable over time.

Based on this quarter, Morgan Stanley looks more like the latter.

Join over 1.2M+ investors/traders who receive daily and weekly notable earnings alerts with predicted move
