ajax loader

Loading...


Ride-the-Wave Strategy – Best for Stock Traders

Ride-the-Wave targets multi-day price momentum following a company’s earnings announcement (EA). With this strategy:

  1. Buy a stock one day post-EA if a stock reacts positively post-earnings:
    1. Near the close of trading the EA-day for a pre-market-EA
    2. Near the close of the following day for a post-market-EA
  2. Sell-to-close after 7-10 days, or possibly earlier if a desired price target is reached

Similarly,

  1. short a stock one day post-EA if a stock reacts negatively post-earnings:
    1. near the close of trading the EA-day for a premarket-EA
    2. near the close of the following day for a post-market-EA
  2. then buy-to-close after 7-10 days, or possibly earlier if a desired price target is reached

Important: Ride-the-Wave is predicated on significant price momentum triggered by an EA. The 7-10 day scenario is the maximum trade hold-time. If you see post EA-momentum is halted or reversed by a significant opposite move, re-evaluate your presence in the trade.

This popular StockEarnings screen below will give you a list of stocks that historically exhibit significant price momentum following an EA for the next seven days:

  1. Stocks exhibiting positive post-EA price moves are buy-candidates
  2. Stocks exhibiting negative post-EA price moves are sell/short-candidates

The screen includes those stocks whose Earnings just came out in last two days.

Screen criteria:

  1. Earnings Date Start Date : Current Date + -1 Day
  2. Earnings Date End Date : Current Date + -2 Days
  3. Predicted Move (Next Day) Max : 7%
  4. Predicted Move (On 7th Day) Min : 7%

Strategy Guideline:

  1. Buy the stock if stock has reacted positively. Short the stock if stock has reacted negatively (see above).
  2. Close the position in 7-10 days, or possibly earlier based on price move.

Volatility Crush Strategy - Best for Options Traders

The Volatility Crush strategy is used with stocks that typically experience relatively low-to-moderate price moves (≤4%) following their Earnings Announcements (EA). The basic trade idea is to sell put or call options right before the EA, collecting a credit when options premium is very high due to elevated implied volatility (IV). You then close the position right after the EA by buying the option back much cheaper due to the significant drop in IV that occurs after the mystery of the EA disappears. In assessing this trade, you need to do your homework to ensure you collect sufficient premium to make the trade worthwhile.

This trade is practical due to the low-to-moderate price-move after the EA, which generally won’t significantly affect the options price, unlike an “action” stock, which experience great price moves post-EA. With these symbols, if you’re on the right side of the price move, that’s a great thing. But if you’re on the wrong side of the move, not so great. Consequently, by minimizing the effect of the post-EA price move, you have a much better chance to profit from the reduction in IV without it being ruined by a violent price move.

For this trade, open the position either (1) the night before the EA when the company announces earnings or (2) during the EA day when it announces post-market, generally capturing IV at or close to its peak.

For this trade, open the position either (1) the night before the EA when the company announces earnings or (2) during the EA day when it announces post-market, generally capturing IV at or close to its peak.

This popular stockearnings screen will give you a list of stocks which do not react more than 4% fpost-EA. It includes only those stocks whose earnings are releasing next day.

Screen criteria:

  1. Earnings Date Start Date : Current Date + 1
  2. Earnings Date End Date : Current Date + 1
  3. Predicted Move (Next Day) Max : 4%
  4. Options Type: Weekly

Strategy Guideline:

  1. Options Strategy: Sell Call and Put
  2. Options Strike Price: Current Stock Price – (% Predicated Move x 2)
  3. Expiration Date: It should generally be the closest expiry immediately after the EA.
  4. Buy Insurance: Buying back Call and Put at Strike price which 10% lower than Sell Strike Price is optional but recommended.

Watch Video for More Detail

Volatility Rush Strategy - Best for Options Traders

The Volatility Rush takes advantage of increasing options premiums into earnings announcements (EA) caused by an anticipated rise in Implied Volatility (IV). With this strategy, Buy a Call and Put at-the-money (a long straddle) 2-3 weeks before the EA when IV is lower. Sell the position either (1) the night before the EA when the company announces earnings pre-market, or (2) during the EA day when it announces post-market, generally capturing IV at or close to its peak.

This popular screen will give you a list of stocks whose Options premiums tend to rise into Earnings. It includes only those stocks whose Earnings are at least two weeks away from today.

Screen criteria:

  1. Earnings Date Start Date : Current Date + 15 Days
  2. Earnings Date End Date : Current Date + 30 Days
  3. Predicted Move (Next Day) Min : 5%
  4. Options Type: Weekly or Monthly if that lines up with the two to three-week lead-time for entering the trade

Strategy Guideline:

  1. Buy a Straddle at or close to the money two to three weeks pre-EA.
  2. Sell the position either the night before the EA when the company announces earnings pre-market, or during the EA day when it announces post-market.
  3. Expiration date should generally be the closest expiry immediately after the EA.
  4. Straddle price should not be more 60% of predicted move.

Predicted Move (Volatility)

Similar to Implied Volatility in Options. Expected volatility % based on our Proprietary Volatility Predication Model. We are expecting that stock price will likely to reach % in either direction by the end of next trading session after Earnings are released and not necessarily the closing volatility %.

Why is it important?

    This indicator helps

  1. Knowing expected volatility in stocks after Earnings helps to decide trading stocks before Earnings Announcement.
  2. Taking Advantage of volatility collapse following Earnings Results by using Advance Options strategies such as Spread and Straddles.

Since Last Earnings

Change in share price since last Earnings release.

Why is it Important?

When share has gained more than 10% since it's last Earning release, it tends to over react to minor bad news and give up some gains if not all. So, it contains more downside volatility than upside When share has dropped more than 10% since it's last Earning release, it tends to over react to minor good news and recover some drops if not all. So, it contains more upside volatility than downside.

EPS Surprise (%)

Occurs when a company's reported quarterly or annual profits are above or below analysts' expectations. Here is the formula to derive % EPS Surprice:

Actual EPS - Estimated EPS
------------------------------------- x 100
Estimated EPS

Why is it Important?

Earnings surprises can have a huge impact on a company's stock price. Several studies suggest that positive earnings surprises not only lead to an immediate hike in a stock's price, but also to a gradual increase over time. Hence, it's not surprising that some companies are known for routinely beating earning projections. A negative earnings surprise will usually result in a decline in share price.

Next Day Price Change (%)

Next Regular trading session Closing price following Earnings result.

For After Market Close Earnings, It is a next trading day closing price. For Before Market Open Earnings, It is the same trading day closing price.

Why is it Important?

Next Day price change is a reaction of Earnings result.

Kinder Morgan Q2 Earnings Show Why Midstream Stocks Deserve a Second Look

Posted on Jul 23, 2026 by Chris Markoch

Kinder Morgan Q2 Earnings Show Why Midstream Stocks Deserve a Second Look

Kinder Morgan (NYSE: KMI) just delivered a second-quarter earnings report that midstream investors shouldn’t ignore. The pipeline giant posted record net income of $867 million, up 21% year-over-year, alongside adjusted EPS of $0.37, a 32% jump from a year ago. That’s the kind of growth story usually reserved for tech names, not “boring” pipeline operators.

While traders chase AI infrastructure plays, Kinder Morgan compounds cash flow through fee-based contracts tied to natural gas demand. The company’s $9.6 billion project backlog dwarfs many peers, and management now expects to beat its full-year Adjusted EBITDA budget by more than 5%.

The board also approved a dividend increase to $0.2975 per share, a 2% bump, continuing a pattern of steady payout growth. For income investors, that combination of earnings acceleration and rising dividends is rare.

This report also reinforces a broader thesis: midstream energy infrastructure could be the forgotten leg of the AI power trade. Data centers need electricity, electricity increasingly comes from natural gas, and natural gas needs pipelines. Kinder Morgan sits at that intersection.

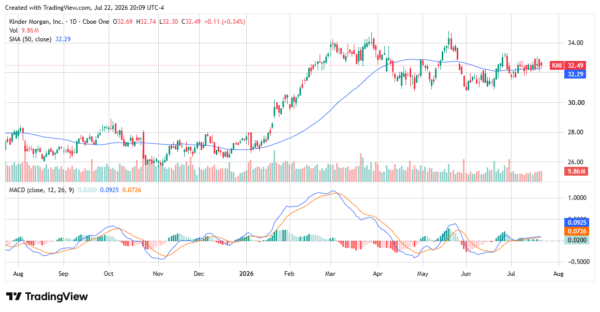
Shares reacted modestly after the report, trading near $32.49, just above the stock’s 50-day moving average. But the fundamentals point to a company executing better than the market currently prices in — and that gap may not last.

Record Earnings Growth Signals Underappreciated Momentum


Kinder Morgan’s second quarter wasn’t just solid. It was the best second quarter in company history. Net income hit $867 million, and Adjusted EBITDA reached $2.199 billion, up 12% from last year.

Executive Chairman Richard Kinder pointed to rising LNG exports and power demand as tailwinds. CEO Kim Dang echoed that, citing $2 billion in operating cash flow and $1 billion in free cash flow for the quarter.

Natural gas transport volumes climbed 7%, while gathering volumes surged 26%, led by the company’s KinderHawk system. These aren’t one-time gains. They reflect structural demand growth tied to LNG exports and data center power needs.

For a company often labeled “slow and steady,” this is genuine acceleration. That’s the part of the story many investors are still missing.

A Backlog That Outpaces the Sector

Kinder Morgan ended the quarter with a $9.6 billion project backlog, even after placing roughly $660 million of projects into service. Nearly 92% of that backlog is natural gas-related, and most of it supports power generation demand.

kinder morgan - StockEarnings

That backlog matters because it’s essentially locked-in future earnings. Management expects an aggregate first-year EBITDA multiple of about 5.6 times on the remaining $8.5 billion. Few midstream peers can point to a pipeline of projects this large, this visible, or this tied to a durable demand driver like electricity generation.

Combined with a Net Debt-to-EBITDA ratio of 3.6 times, near the low end of its target range, Kinder Morgan has room to keep funding growth internally.

Technical Setup: Stock Consolidating Near Support

KMI shares have traded in a range near $32 to $34 since May, after a strong run from below $28 late last year. The stock currently sits at $32.49, just above its 50-day moving average of $32.29.

The MACD line remains near flat, suggesting the stock is consolidating rather than trending strongly in either direction. Volume has moderated compared to the sharp rally earlier in 2026.

This pattern often precedes a breakout once a catalyst arrives. Earnings, paired with a dividend hike, could serve as that trigger if buyers step back in above the moving average.
kinder morgan - StockEarnings

Why KMI Belongs on Investor Watchlists

Kinder Morgan’s combination of earnings growth, dividend increases, and a record backlog makes a compelling case that midstream stocks deserve more attention this earnings season. The stock also offers ETF exposure through funds like the Global X MLP & Energy Infrastructure ETF (NYSEARCA: MLPX), where Kinder Morgan represents roughly 7.5% of holdings, alongside peers like Enbridge (NYSE: ENB) and TC Energy (NYSE: TRP).

Whether investors buy KMI directly or through diversified midstream ETFs, the underlying thesis remains the same. Natural gas infrastructure is becoming AI infrastructure, and Kinder Morgan is positioned at the center of that shift. For investors overlooking the sector, this earnings report is a reminder to reconsider that idea.


A former marketing copywriter turned freelance financial writer and market analyst. I have a passion for delivering insights to investors. I write regularly about stocks for StockEarnings and MarketBeat. Posts are not advice.

Join over 1.2M+ investors/traders who receive daily and weekly notable earnings alerts with predicted move