ajax loader

Loading...


Ride-the-Wave Strategy – Best for Stock Traders

Ride-the-Wave targets multi-day price momentum following a company’s earnings announcement (EA). With this strategy:

  1. Buy a stock one day post-EA if a stock reacts positively post-earnings:
    1. Near the close of trading the EA-day for a pre-market-EA
    2. Near the close of the following day for a post-market-EA
  2. Sell-to-close after 7-10 days, or possibly earlier if a desired price target is reached

Similarly,

  1. short a stock one day post-EA if a stock reacts negatively post-earnings:
    1. near the close of trading the EA-day for a premarket-EA
    2. near the close of the following day for a post-market-EA
  2. then buy-to-close after 7-10 days, or possibly earlier if a desired price target is reached

Important: Ride-the-Wave is predicated on significant price momentum triggered by an EA. The 7-10 day scenario is the maximum trade hold-time. If you see post EA-momentum is halted or reversed by a significant opposite move, re-evaluate your presence in the trade.

This popular StockEarnings screen below will give you a list of stocks that historically exhibit significant price momentum following an EA for the next seven days:

  1. Stocks exhibiting positive post-EA price moves are buy-candidates
  2. Stocks exhibiting negative post-EA price moves are sell/short-candidates

The screen includes those stocks whose Earnings just came out in last two days.

Screen criteria:

  1. Earnings Date Start Date : Current Date + -1 Day
  2. Earnings Date End Date : Current Date + -2 Days
  3. Predicted Move (Next Day) Max : 7%
  4. Predicted Move (On 7th Day) Min : 7%

Strategy Guideline:

  1. Buy the stock if stock has reacted positively. Short the stock if stock has reacted negatively (see above).
  2. Close the position in 7-10 days, or possibly earlier based on price move.

Volatility Crush Strategy - Best for Options Traders

The Volatility Crush strategy is used with stocks that typically experience relatively low-to-moderate price moves (≤4%) following their Earnings Announcements (EA). The basic trade idea is to sell put or call options right before the EA, collecting a credit when options premium is very high due to elevated implied volatility (IV). You then close the position right after the EA by buying the option back much cheaper due to the significant drop in IV that occurs after the mystery of the EA disappears. In assessing this trade, you need to do your homework to ensure you collect sufficient premium to make the trade worthwhile.

This trade is practical due to the low-to-moderate price-move after the EA, which generally won’t significantly affect the options price, unlike an “action” stock, which experience great price moves post-EA. With these symbols, if you’re on the right side of the price move, that’s a great thing. But if you’re on the wrong side of the move, not so great. Consequently, by minimizing the effect of the post-EA price move, you have a much better chance to profit from the reduction in IV without it being ruined by a violent price move.

For this trade, open the position either (1) the night before the EA when the company announces earnings or (2) during the EA day when it announces post-market, generally capturing IV at or close to its peak.

For this trade, open the position either (1) the night before the EA when the company announces earnings or (2) during the EA day when it announces post-market, generally capturing IV at or close to its peak.

This popular stockearnings screen will give you a list of stocks which do not react more than 4% fpost-EA. It includes only those stocks whose earnings are releasing next day.

Screen criteria:

  1. Earnings Date Start Date : Current Date + 1
  2. Earnings Date End Date : Current Date + 1
  3. Predicted Move (Next Day) Max : 4%
  4. Options Type: Weekly

Strategy Guideline:

  1. Options Strategy: Sell Call and Put
  2. Options Strike Price: Current Stock Price – (% Predicated Move x 2)
  3. Expiration Date: It should generally be the closest expiry immediately after the EA.
  4. Buy Insurance: Buying back Call and Put at Strike price which 10% lower than Sell Strike Price is optional but recommended.

Watch Video for More Detail

Volatility Rush Strategy - Best for Options Traders

The Volatility Rush takes advantage of increasing options premiums into earnings announcements (EA) caused by an anticipated rise in Implied Volatility (IV). With this strategy, Buy a Call and Put at-the-money (a long straddle) 2-3 weeks before the EA when IV is lower. Sell the position either (1) the night before the EA when the company announces earnings pre-market, or (2) during the EA day when it announces post-market, generally capturing IV at or close to its peak.

This popular screen will give you a list of stocks whose Options premiums tend to rise into Earnings. It includes only those stocks whose Earnings are at least two weeks away from today.

Screen criteria:

  1. Earnings Date Start Date : Current Date + 15 Days
  2. Earnings Date End Date : Current Date + 30 Days
  3. Predicted Move (Next Day) Min : 5%
  4. Options Type: Weekly or Monthly if that lines up with the two to three-week lead-time for entering the trade

Strategy Guideline:

  1. Buy a Straddle at or close to the money two to three weeks pre-EA.
  2. Sell the position either the night before the EA when the company announces earnings pre-market, or during the EA day when it announces post-market.
  3. Expiration date should generally be the closest expiry immediately after the EA.
  4. Straddle price should not be more 60% of predicted move.

Predicted Move (Volatility)

Similar to Implied Volatility in Options. Expected volatility % based on our Proprietary Volatility Predication Model. We are expecting that stock price will likely to reach % in either direction by the end of next trading session after Earnings are released and not necessarily the closing volatility %.

Why is it important?

    This indicator helps

  1. Knowing expected volatility in stocks after Earnings helps to decide trading stocks before Earnings Announcement.
  2. Taking Advantage of volatility collapse following Earnings Results by using Advance Options strategies such as Spread and Straddles.

Since Last Earnings

Change in share price since last Earnings release.

Why is it Important?

When share has gained more than 10% since it's last Earning release, it tends to over react to minor bad news and give up some gains if not all. So, it contains more downside volatility than upside When share has dropped more than 10% since it's last Earning release, it tends to over react to minor good news and recover some drops if not all. So, it contains more upside volatility than downside.

EPS Surprise (%)

Occurs when a company's reported quarterly or annual profits are above or below analysts' expectations. Here is the formula to derive % EPS Surprice:

Actual EPS - Estimated EPS
------------------------------------- x 100
Estimated EPS

Why is it Important?

Earnings surprises can have a huge impact on a company's stock price. Several studies suggest that positive earnings surprises not only lead to an immediate hike in a stock's price, but also to a gradual increase over time. Hence, it's not surprising that some companies are known for routinely beating earning projections. A negative earnings surprise will usually result in a decline in share price.

Next Day Price Change (%)

Next Regular trading session Closing price following Earnings result.

For After Market Close Earnings, It is a next trading day closing price. For Before Market Open Earnings, It is the same trading day closing price.

Why is it Important?

Next Day price change is a reaction of Earnings result.

Again, PayPal’s Q1 Earnings Look Better, Yet The Market Keeps Selling It

Posted on May 05, 2026 by Grayson Cavern

Again, PayPal’s Q1 Earnings Look Better, Yet The Market Keeps Selling It

PayPal Holdings Inc (NASDAQ: PYPL) reported Q1 2026 earnings beat with a revenue of $7.7 billion, EPS of $1.08, and Total Payment Volume of roughly $403 billion, extending a pattern the company has built over the past year: steady growth, controlled execution, and numbers that, on the surface, suggest a business regaining its footing.

But once you look at it properly, these are not the numbers of a company accelerating into a new phase; they are the numbers of a company stabilizing, smoothing, and tightening what it already has, and the market can tell the difference. That’s because when growth is real, it pulls everything with it – volume, margins, sentiment, and price. But when growth is controlled rather than expanding, it shows up exactly like this: solid earnings, restrained reaction, and a stock that still needs to prove itself again the moment the report is over.

Doubtful Investors And A $1.5 Billion Buyback


If you line Q1 2026 up against Q1 2025, the story becomes clearer. PayPal is still processing hundreds of billions in volume each quarter, around $403 billion, while revenue sits in the same $7+ billion range, which tells you the business hasn’t broken, but it also hasn’t meaningfully accelerated.

That’s where the tension comes in. Volume is growing, but what the company earns from that volume is not expanding at the same rate, which means more activity is flowing through the system without a proportional increase in economic value per transaction. And that distinction matters more than the headline numbers, because a business that scales cleanly gets stronger as it grows, while one that scales under pressure becomes more dependent on efficiency to maintain the same level of output.

You can see that pressure indirectly in how PayPal is supporting its earnings. The company repurchased about $1.5 billion of its own stock in the quarter, which helps sustain earnings per share even when underlying growth isn’t doing all the work.

There’s nothing wrong with that on its own. But when buybacks become this visible, the question shifts from whether the numbers are improving to how they are improving, and that’s where conviction starts to weaken.

PayPal Is Selling A Bigger Future Amidst Customers’ Complaints

PayPal is trying to push beyond that perception by leaning into AI, rolling out agentic commerce tools designed to power automated, AI-driven transactions, positioning itself as infrastructure for how people will shop and pay in the future.

On paper, it’s the right move. It expands the narrative beyond payments and gives investors something forward-looking to hold onto. But right now, it hasn’t translated into a shift in how the business is valued or trusted, because it hasn’t yet shown up in a way that changes the trajectory of growth. It reads like an extension of what PayPal already is, not a transformation into something meaningfully different.

Not to mention, while the company is pushing that future-facing story, the present still carries friction. Users continue to complain about fees, about better alternatives, about choosing not to use PayPal unless they have to. That kind of sentiment doesn’t break a business overnight, but it caps enthusiasm, and when enthusiasm is capped, valuation follows.

A Relentless and Reluctant Market

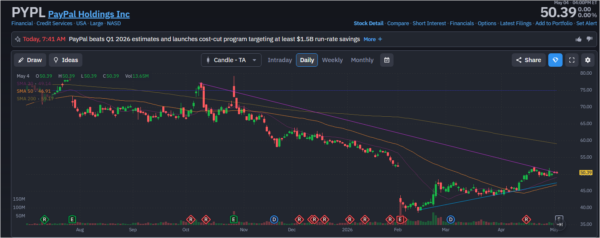
The chart in PayPal reflects the same tension sitting inside the earnings, because while price reacted positively and pushed into the $50 – $51 range after the release, that move immediately ran into structural pressure from the broader downtrend, with the declining 200-day moving average still hovering near $59 and acting as overhead resistance that has not yet been reclaimed.

What stands out isn’t the initial reaction, but the lack of follow-through, as price failed to expand with force and instead settled into a controlled consolidation just above the 20-day and 50-day moving averages around $48–$49, suggesting that while buyers are present, they are not committing aggressively enough to shift the longer-term structure.

Volume reinforces that read, because although there was a clear spike around earnings, participation tapered off quickly afterward, which is not what you see when institutions are building conviction, but rather when they are probing and reassessing.

So while the stock is holding a rising base from the February lows near $40, indicating stabilization, it remains a move that looks supported, not sponsored, and until the price can reclaim the mid-$50s with sustained volume, this is a market reacting to the numbers, not fully believing them.

/
paypal - StockEarnings

When The Sad Pattern Appears Again

If you’ve been around for a while, you’d agree with me that this same sequence keeps showing up around PayPal’s earnings, quarter after quarter, and year after year. The company delivers a beat, the stock reacts, and then the move fades as the market reassesses what those numbers actually mean. It doesn’t collapse because the business isn’t broken, but it doesn’t run either, because the belief isn’t strong enough to carry it.

Look, strong companies don’t need time to validate their earnings. They get paid immediately because the market trusts what it’s seeing. PayPal, on the other hand, keeps falling into a cycle where the numbers arrive first and the belief tries to catch up later, and often doesn’t fully get there. As such, I’d rather focus my time and money on other companies backed up by both strong convictions and numbers, instead of catching this falling knife.


Join over 1.2M+ investors/traders who receive daily and weekly notable earnings alerts with predicted move