ajax loader

Loading...


Ride-the-Wave Strategy – Best for Stock Traders

Ride-the-Wave targets multi-day price momentum following a company’s earnings announcement (EA). With this strategy:

  1. Buy a stock one day post-EA if a stock reacts positively post-earnings:
    1. Near the close of trading the EA-day for a pre-market-EA
    2. Near the close of the following day for a post-market-EA
  2. Sell-to-close after 7-10 days, or possibly earlier if a desired price target is reached

Similarly,

  1. short a stock one day post-EA if a stock reacts negatively post-earnings:
    1. near the close of trading the EA-day for a premarket-EA
    2. near the close of the following day for a post-market-EA
  2. then buy-to-close after 7-10 days, or possibly earlier if a desired price target is reached

Important: Ride-the-Wave is predicated on significant price momentum triggered by an EA. The 7-10 day scenario is the maximum trade hold-time. If you see post EA-momentum is halted or reversed by a significant opposite move, re-evaluate your presence in the trade.

This popular StockEarnings screen below will give you a list of stocks that historically exhibit significant price momentum following an EA for the next seven days:

  1. Stocks exhibiting positive post-EA price moves are buy-candidates
  2. Stocks exhibiting negative post-EA price moves are sell/short-candidates

The screen includes those stocks whose Earnings just came out in last two days.

Screen criteria:

  1. Earnings Date Start Date : Current Date + -1 Day
  2. Earnings Date End Date : Current Date + -2 Days
  3. Predicted Move (Next Day) Max : 7%
  4. Predicted Move (On 7th Day) Min : 7%

Strategy Guideline:

  1. Buy the stock if stock has reacted positively. Short the stock if stock has reacted negatively (see above).
  2. Close the position in 7-10 days, or possibly earlier based on price move.

Volatility Crush Strategy - Best for Options Traders

The Volatility Crush strategy is used with stocks that typically experience relatively low-to-moderate price moves (≤4%) following their Earnings Announcements (EA). The basic trade idea is to sell put or call options right before the EA, collecting a credit when options premium is very high due to elevated implied volatility (IV). You then close the position right after the EA by buying the option back much cheaper due to the significant drop in IV that occurs after the mystery of the EA disappears. In assessing this trade, you need to do your homework to ensure you collect sufficient premium to make the trade worthwhile.

This trade is practical due to the low-to-moderate price-move after the EA, which generally won’t significantly affect the options price, unlike an “action” stock, which experience great price moves post-EA. With these symbols, if you’re on the right side of the price move, that’s a great thing. But if you’re on the wrong side of the move, not so great. Consequently, by minimizing the effect of the post-EA price move, you have a much better chance to profit from the reduction in IV without it being ruined by a violent price move.

For this trade, open the position either (1) the night before the EA when the company announces earnings or (2) during the EA day when it announces post-market, generally capturing IV at or close to its peak.

For this trade, open the position either (1) the night before the EA when the company announces earnings or (2) during the EA day when it announces post-market, generally capturing IV at or close to its peak.

This popular stockearnings screen will give you a list of stocks which do not react more than 4% fpost-EA. It includes only those stocks whose earnings are releasing next day.

Screen criteria:

  1. Earnings Date Start Date : Current Date + 1
  2. Earnings Date End Date : Current Date + 1
  3. Predicted Move (Next Day) Max : 4%
  4. Options Type: Weekly

Strategy Guideline:

  1. Options Strategy: Sell Call and Put
  2. Options Strike Price: Current Stock Price – (% Predicated Move x 2)
  3. Expiration Date: It should generally be the closest expiry immediately after the EA.
  4. Buy Insurance: Buying back Call and Put at Strike price which 10% lower than Sell Strike Price is optional but recommended.

Watch Video for More Detail

Volatility Rush Strategy - Best for Options Traders

The Volatility Rush takes advantage of increasing options premiums into earnings announcements (EA) caused by an anticipated rise in Implied Volatility (IV). With this strategy, Buy a Call and Put at-the-money (a long straddle) 2-3 weeks before the EA when IV is lower. Sell the position either (1) the night before the EA when the company announces earnings pre-market, or (2) during the EA day when it announces post-market, generally capturing IV at or close to its peak.

This popular screen will give you a list of stocks whose Options premiums tend to rise into Earnings. It includes only those stocks whose Earnings are at least two weeks away from today.

Screen criteria:

  1. Earnings Date Start Date : Current Date + 15 Days
  2. Earnings Date End Date : Current Date + 30 Days
  3. Predicted Move (Next Day) Min : 5%
  4. Options Type: Weekly or Monthly if that lines up with the two to three-week lead-time for entering the trade

Strategy Guideline:

  1. Buy a Straddle at or close to the money two to three weeks pre-EA.
  2. Sell the position either the night before the EA when the company announces earnings pre-market, or during the EA day when it announces post-market.
  3. Expiration date should generally be the closest expiry immediately after the EA.
  4. Straddle price should not be more 60% of predicted move.

Predicted Move (Volatility)

Similar to Implied Volatility in Options. Expected volatility % based on our Proprietary Volatility Predication Model. We are expecting that stock price will likely to reach % in either direction by the end of next trading session after Earnings are released and not necessarily the closing volatility %.

Why is it important?

    This indicator helps

  1. Knowing expected volatility in stocks after Earnings helps to decide trading stocks before Earnings Announcement.
  2. Taking Advantage of volatility collapse following Earnings Results by using Advance Options strategies such as Spread and Straddles.

Since Last Earnings

Change in share price since last Earnings release.

Why is it Important?

When share has gained more than 10% since it's last Earning release, it tends to over react to minor bad news and give up some gains if not all. So, it contains more downside volatility than upside When share has dropped more than 10% since it's last Earning release, it tends to over react to minor good news and recover some drops if not all. So, it contains more upside volatility than downside.

EPS Surprise (%)

Occurs when a company's reported quarterly or annual profits are above or below analysts' expectations. Here is the formula to derive % EPS Surprice:

Actual EPS - Estimated EPS
------------------------------------- x 100
Estimated EPS

Why is it Important?

Earnings surprises can have a huge impact on a company's stock price. Several studies suggest that positive earnings surprises not only lead to an immediate hike in a stock's price, but also to a gradual increase over time. Hence, it's not surprising that some companies are known for routinely beating earning projections. A negative earnings surprise will usually result in a decline in share price.

Next Day Price Change (%)

Next Regular trading session Closing price following Earnings result.

For After Market Close Earnings, It is a next trading day closing price. For Before Market Open Earnings, It is the same trading day closing price.

Why is it Important?

Next Day price change is a reaction of Earnings result.

Nike Earnings Better Than Feared: Is NKE Stock Ready to Rally?

Posted on Jul 01, 2026 by Chris Markoch

Nike Earnings Better Than Feared: Is NKE Stock Ready to Rally?

Nike, Inc. (NYSE: NKE) delivered fiscal 2026 fourth-quarter results that topped Wall Street’s revenue and earnings expectations, yet shares fell roughly 7% following the June 30 release, but had cut its loss to just around 1% after the subsequent conference call.

The recovery from steeper after-hours losses suggests investors are looking past the headline beat and focusing on something more specific: weak forward guidance paired with early signs that new financial discipline is starting to take hold. That means this Nike earnings report is, at its core, a margin story.

For the quarter ended May 31, Nike posted revenue of $11.0 billion, down 1% on a reported basis and down 4% on a currency-neutral basis. Diluted earnings per share came in at $0.72, a dramatic jump from $0.14 in the prior-year period. Net income surged 407% to $1.07 billion.

On the surface, that’s a blowout. But $0.52 of that $0.72 in EPS came from an expected recovery of tariffs paid under the International Emergency Economic Powers Act (IEEPA), following a February Supreme Court ruling that the tariffs were unauthorized. Strip that one-time benefit out, and underlying profitability looks far less dramatic, which is exactly why guidance, not the beat itself, is driving the stock’s reaction.

For full fiscal 2026, revenue was $46.4 billion, essentially flat year over year, while diluted EPS fell 3% to $2.10.

Tariff Windfall Inflates the Headline Numbers


The tariff recovery is the most visible story in this report, but it isn’t the one that matters most for where the stock goes next. Nike said the expected IEEPA tariff refund added approximately $986 million to gross profit in the quarter, lifting gross margin by about 900 basis points. Reported gross margin came in at 49.2%, up 890 basis points year over year. That number looks extraordinary until you realize most of the improvement is a one-time accounting benefit rather than pricing power or cost discipline.

North America segment EBIT jumped 91% to $2.0 billion, but $965 million of that gain was tied directly to the tariff recovery. Total NIKE Brand EBIT for the quarter rose 108% to $1.86 billion, again heavily flattered by the same item. Management’s guidance for the coming year came in below expectations, and that’s the more important signal here. Investors aren’t punishing Nike for a messy quarter; they’re recalibrating around a softer near-term outlook.

Inventory Discipline Hints at a Margin Story Taking Shape

The more interesting development sits in the balance sheet. Inventories were $7.5 billion, essentially flat year over year, with the company noting that an increase in units was offset by shifts in product mix. That’s a subtle but meaningful detail. Under CFO Matthew Friend, Nike appears to be managing inventory more tightly than in recent years, favoring cleaner sell-through over chasing top-line volume.

Tighter inventory control typically shows up in financial statements well before it shows up in margins, since it takes time for reduced discounting and markdown activity to flow through gross margin. The fourth quarter’s tariff-driven margin spike may be obscuring this slower, more durable trend, but it’s the one worth watching into fiscal 2027.

Wholesale revenue grew 4% to $6.6 billion, helped by North America’s strength that offset declines in Greater China. That’s a sign that retail partners remain willing to take on inventory even as Nike manages supply more carefully. NIKE Direct fell 7% to $4.1 billion, with digital sales down 12%, reflecting the brand’s deliberate pullback from heavy promotional selling to protect full-price realization. Converse remains a clear problem area, with revenue down 32% to $244 million.

Technical Picture Shows a Stock Stuck in a Downtrend

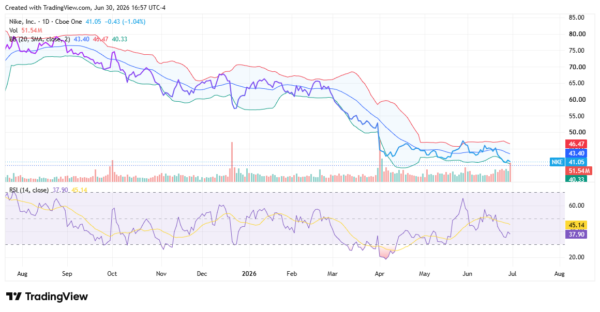
NKE shares closed regular trading at $41.05, down 1.04% on the day, before sliding further after the release. The stock trades below its 50-day simple moving average of $43.40 and near the lower Bollinger Band of $40.33, with the upper band at $46.47. The 14-day RSI is 37.90, below its 45.14 moving average, signaling persistent but not extreme downside momentum. The pattern reflects a stock still searching for a bottom after a months-long downtrend.

nike - StockEarnings

Why the Bears Could Be Right

Skeptics have a fair case. Guidance for the year ahead was weak, Greater China revenue fell 12% in the quarter, and the core earnings beat leans almost entirely on a non-recurring tariff recovery.

Inventory discipline is a promising early signal, but it hasn’t yet translated into underlying margin expansion. If the new CFO’s tighter cost and inventory controls take longer than expected to translate into profitability, the stock’s downtrend could persist well into fiscal 2027.

A Speculative Opportunity Hiding in Plain Sight

Still, there’s a case for patient, risk-tolerant investors to take notice. Nike’s valuation has compressed substantially alongside the stock price, wholesale demand is stabilizing, and China weakness is now a known, well-priced risk rather than a surprise. The inventory discipline showing up this quarter is the kind of detail that often precedes a genuine margin recovery, even if guidance suggests that recovery won’t be immediate.

This isn’t a screaming buy. It’s closer to a “what more does it have to do?” situation, where soft guidance is already reflected in the price and any sign of consistent execution on costs and inventory could spark a re-rating. For investors willing to make a speculative bet that Nike’s new financial discipline is real and durable, the current pullback may be more of an opportunity than a warning sign.

A former marketing copywriter turned freelance financial writer and market analyst. I have a passion for delivering insights to investors. I write regularly about stocks for StockEarnings and MarketBeat. Posts are not advice.

Join over 1.2M+ investors/traders who receive daily and weekly notable earnings alerts with predicted move