ajax loader

Loading...


Ride-the-Wave Strategy – Best for Stock Traders

Ride-the-Wave targets multi-day price momentum following a company’s earnings announcement (EA). With this strategy:

  1. Buy a stock one day post-EA if a stock reacts positively post-earnings:
    1. Near the close of trading the EA-day for a pre-market-EA
    2. Near the close of the following day for a post-market-EA
  2. Sell-to-close after 7-10 days, or possibly earlier if a desired price target is reached

Similarly,

  1. short a stock one day post-EA if a stock reacts negatively post-earnings:
    1. near the close of trading the EA-day for a premarket-EA
    2. near the close of the following day for a post-market-EA
  2. then buy-to-close after 7-10 days, or possibly earlier if a desired price target is reached

Important: Ride-the-Wave is predicated on significant price momentum triggered by an EA. The 7-10 day scenario is the maximum trade hold-time. If you see post EA-momentum is halted or reversed by a significant opposite move, re-evaluate your presence in the trade.

This popular StockEarnings screen below will give you a list of stocks that historically exhibit significant price momentum following an EA for the next seven days:

  1. Stocks exhibiting positive post-EA price moves are buy-candidates
  2. Stocks exhibiting negative post-EA price moves are sell/short-candidates

The screen includes those stocks whose Earnings just came out in last two days.

Screen criteria:

  1. Earnings Date Start Date : Current Date + -1 Day
  2. Earnings Date End Date : Current Date + -2 Days
  3. Predicted Move (Next Day) Max : 7%
  4. Predicted Move (On 7th Day) Min : 7%

Strategy Guideline:

  1. Buy the stock if stock has reacted positively. Short the stock if stock has reacted negatively (see above).
  2. Close the position in 7-10 days, or possibly earlier based on price move.

Volatility Crush Strategy - Best for Options Traders

The Volatility Crush strategy is used with stocks that typically experience relatively low-to-moderate price moves (≤4%) following their Earnings Announcements (EA). The basic trade idea is to sell put or call options right before the EA, collecting a credit when options premium is very high due to elevated implied volatility (IV). You then close the position right after the EA by buying the option back much cheaper due to the significant drop in IV that occurs after the mystery of the EA disappears. In assessing this trade, you need to do your homework to ensure you collect sufficient premium to make the trade worthwhile.

This trade is practical due to the low-to-moderate price-move after the EA, which generally won’t significantly affect the options price, unlike an “action” stock, which experience great price moves post-EA. With these symbols, if you’re on the right side of the price move, that’s a great thing. But if you’re on the wrong side of the move, not so great. Consequently, by minimizing the effect of the post-EA price move, you have a much better chance to profit from the reduction in IV without it being ruined by a violent price move.

For this trade, open the position either (1) the night before the EA when the company announces earnings or (2) during the EA day when it announces post-market, generally capturing IV at or close to its peak.

For this trade, open the position either (1) the night before the EA when the company announces earnings or (2) during the EA day when it announces post-market, generally capturing IV at or close to its peak.

This popular stockearnings screen will give you a list of stocks which do not react more than 4% fpost-EA. It includes only those stocks whose earnings are releasing next day.

Screen criteria:

  1. Earnings Date Start Date : Current Date + 1
  2. Earnings Date End Date : Current Date + 1
  3. Predicted Move (Next Day) Max : 4%
  4. Options Type: Weekly

Strategy Guideline:

  1. Options Strategy: Sell Call and Put
  2. Options Strike Price: Current Stock Price – (% Predicated Move x 2)
  3. Expiration Date: It should generally be the closest expiry immediately after the EA.
  4. Buy Insurance: Buying back Call and Put at Strike price which 10% lower than Sell Strike Price is optional but recommended.

Watch Video for More Detail

Volatility Rush Strategy - Best for Options Traders

The Volatility Rush takes advantage of increasing options premiums into earnings announcements (EA) caused by an anticipated rise in Implied Volatility (IV). With this strategy, Buy a Call and Put at-the-money (a long straddle) 2-3 weeks before the EA when IV is lower. Sell the position either (1) the night before the EA when the company announces earnings pre-market, or (2) during the EA day when it announces post-market, generally capturing IV at or close to its peak.

This popular screen will give you a list of stocks whose Options premiums tend to rise into Earnings. It includes only those stocks whose Earnings are at least two weeks away from today.

Screen criteria:

  1. Earnings Date Start Date : Current Date + 15 Days
  2. Earnings Date End Date : Current Date + 30 Days
  3. Predicted Move (Next Day) Min : 5%
  4. Options Type: Weekly or Monthly if that lines up with the two to three-week lead-time for entering the trade

Strategy Guideline:

  1. Buy a Straddle at or close to the money two to three weeks pre-EA.
  2. Sell the position either the night before the EA when the company announces earnings pre-market, or during the EA day when it announces post-market.
  3. Expiration date should generally be the closest expiry immediately after the EA.
  4. Straddle price should not be more 60% of predicted move.

Predicted Move (Volatility)

Similar to Implied Volatility in Options. Expected volatility % based on our Proprietary Volatility Predication Model. We are expecting that stock price will likely to reach % in either direction by the end of next trading session after Earnings are released and not necessarily the closing volatility %.

Why is it important?

    This indicator helps

  1. Knowing expected volatility in stocks after Earnings helps to decide trading stocks before Earnings Announcement.
  2. Taking Advantage of volatility collapse following Earnings Results by using Advance Options strategies such as Spread and Straddles.

Since Last Earnings

Change in share price since last Earnings release.

Why is it Important?

When share has gained more than 10% since it's last Earning release, it tends to over react to minor bad news and give up some gains if not all. So, it contains more downside volatility than upside When share has dropped more than 10% since it's last Earning release, it tends to over react to minor good news and recover some drops if not all. So, it contains more upside volatility than downside.

EPS Surprise (%)

Occurs when a company's reported quarterly or annual profits are above or below analysts' expectations. Here is the formula to derive % EPS Surprice:

Actual EPS - Estimated EPS
------------------------------------- x 100
Estimated EPS

Why is it Important?

Earnings surprises can have a huge impact on a company's stock price. Several studies suggest that positive earnings surprises not only lead to an immediate hike in a stock's price, but also to a gradual increase over time. Hence, it's not surprising that some companies are known for routinely beating earning projections. A negative earnings surprise will usually result in a decline in share price.

Next Day Price Change (%)

Next Regular trading session Closing price following Earnings result.

For After Market Close Earnings, It is a next trading day closing price. For Before Market Open Earnings, It is the same trading day closing price.

Why is it Important?

Next Day price change is a reaction of Earnings result.

Seeking Quick Profits? Look to Boeing Call Options Over the Next 3 Weeks

Posted on Jul 01, 2026 by Joshua Enomoto

Seeking Quick Profits? Look to Boeing Call Options Over the Next 3 Weeks

It’s not the most exciting idea to discuss under most circumstances but Boeing (NYSE: BA) could be an intriguing idea for aggressive debit-side options traders. Basically, the idea is that when BA stock is conditioned for a specific circumstance, there may be a higher probability of performance relative to a random baseline. What’s more, this signal is flashing right now.

To be upfront, I’m not going to waste my time talking about the fundamentals undergirding Boeing stock. The harsh reality is that most financial publications specialize in narrative linear extrapolation using information that is already a matter of public record. As such, you’re not likely to gain an edge from what is nothing more than listening to downstream opinions.

Let’s be brutally honest: in market microstructure terms, by the time a retail newsletter writer notes that a company has a “great brand,” “growing margins,” or a “challenging macroeconomic environment,” that information has already been processed by institutional algorithms, risk-parity models and professional market makers.

Further, it’s incredibly difficult to declare that the market made a mistake in assigning a value on the target security. For example, BA stock is down a little more than 1% on a year-to-date basis. In trailing-month terms, the equity has slipped more than 4%. Bullish analysts might use language to suggest that the selloff is overdone.

However, such arbitration raises the obvious question: how does the analyst know?

Generally speaking, we all agree that the share price of a company represents all publicly available information at that time. So, it’s quite a stretch to assume that some random writer on the internet found a mispricing that every other professional player and institution missed. Unless there’s evidence presented of a mispricing, it’s safe to say such language is simply an example of narrative economics.

For options traders, we need a much more quantitative framework and that’s where an inductive model may be helpful.

No One Knows the True Value of BA Stock


If you really want to know the fundamental argument for BA stock, it’s that the competing Airbus (OTCMKTS: EADSY) A320neo family of jetliners are essentially sold out well into the 2030s. Cynically, if an airline wants to expand its fleet or replace aging jets this decade, it can’t switch to Airbus — the wait times are too long.

Another factor to consider is the de-risked revenue backlog. Boeing sits on a commercial aircraft order backlog exceeding $500 billion (firm orders for thousands of aircraft stretching out over the next decade). Basically, this circumstance provides rare top-line visibility as the demand profile is guaranteed. Some finpubs are using this datapoint to suggest that BA stock is undervalued.

My problem, as I alluded to earlier, is that this backlog — along with other compelling factors supporting Boeing stock — is almost certainly baked into the share price. Therefore, when analysts declare that BA is undervalued, what they’re really saying is that the market somehow hasn’t fully priced in the good news.

I’m sorry but it makes me as a reader ask the glaringly obvious follow-up: what percentage of the good news is not baked into BA stock? 10% 20% What? It’s not an answerable question because — news flash — in order to declare an asset as “undervalued” with absolute certainty, you must first reference an objective, immutable “true” value.

Without that immutable reference, claims of undervaluation are merely supported by trust-me-bro logic.

Using Induction to Trade Boeing Stock

Rather than opine my way toward a conclusion, the more rational solution is to condition the performance of Boeing stock based on measurable signals. If the conditional data outperforms the random baseline, we potentially have an incentive to trade the security. If not, then there’s no point.

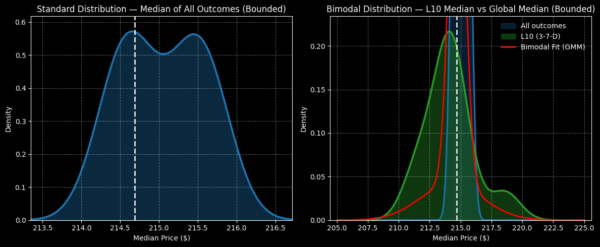
Using data going back to January 2019, a 10-week long position initiated at random for BA stock (assuming a starting price of $214.69) would likely generate a forward distribution landing between $213.50 and $216.50. Further, peak probability density would likely average around $215, thus indicating a modest upward bias.

More importantly, these stats represent our random baseline performance. If a trading signal can’t yield results superior to what we can generate randomly, then it’s not an ideal time to trade.

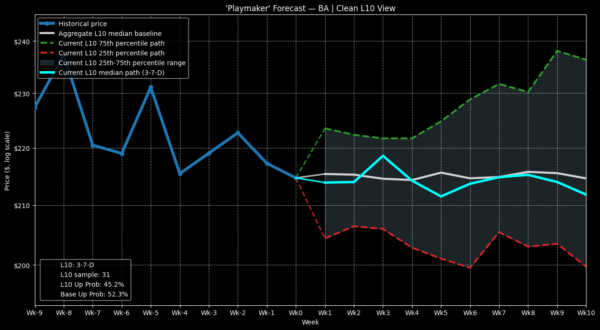
Currently, BA stock is suffering a bearish cycle. In the last 10 weeks, Boeing printed only three up weeks, leading to an overall downward slope across the period. Conditioned for this specific quantitative sequence, the expected forward 10-week distribution is rather poor, clocking in between $207.50 and $221. While the right tail extends further outward, peak probability density of this 3-7-D sequence lands shy of $215, indicating a slightly negative bias.

boeing-StockEarnings

Based on the data, we wouldn’t want to hold BA stock for a 10-week period following the flashing of the 3-7-D signal. However, when looking at the inductive data on a week-by-week basis, we note that BA stock tends to pop upward in the third week.

If you believe that the same trend will follow after the flashing of the current 3-7-D signal, aggressive speculators may want to consider the 217.50/220 bull call spread expiring July 17. If Boeing stock follows previously recognized patterns, it has a legitimate possibility of reaching the $220 strike at expiration.

Of course, the July 17 expiration represents a near-term target, which doesn’t provide BA stock with much time to trigger the necessary strike. However, because the security tends to be negatively choppy following the third week of the signal flashing, we don’t want to expose ourselves any longer than necessary — otherwise, a profitable trade can quickly become unprofitable.

A Reality Check on Induction

Inductive models rely on pattern recognition but this practice is prone to false expectations, particularly the black swan risk. In other words, just because you see a thousand white swans doesn’t mean all swans are white. Once a black swan appears, the entire presupposition evaporates.

So it is with any inductive model. Just because BA stock tends to pop higher following the third week of the 3-7-D signal flashing doesn’t mean it will do so this time around. But then the question becomes, why bother using induction?

boeing-StockEarnings

The answer is that I honestly lack any other method that is intellectually satisfying. As discussed earlier, all fundamentally important news has likely been baked into Boeing stock so reiterating this data doesn’t provide any edge. On the technical front, drawing a bunch of support and resistance lines doesn’t automatically grant legitimacy.

At least with the inductive model, we’re attempting to identify patterns based on real quantitative data. It’s not a perfect methodology but it’s arguably the most rational within a non-determinative environment.

Joshua Enomoto is a seasoned financial writer with a strong track record of in-depth stock analysis, offering clear, insightful commentary for retail investors across all levels of expertise. Renowned for his ability to blend analytical rigor with engaging wit, Joshua's work has been featured on leading investment platforms, including TipRanks, InvestorPlace, Barchart, Benzinga, and Fintel. He was also handpicked to spearhead high-impact initiatives such as InvestorPlace's "Trade of the Day" and Benzinga’s ETF coverage. As a frequent guest expert for CGTN America, Joshua discusses a wide range of economic, societal, and consumer market trends. A graduate of U.C. San Diego, Joshua brings a thoughtful and fresh perspective to complex financial narratives, helping enterprise clients connect with their audiences. He also composes music in his spare time.

Join over 1.2M+ investors/traders who receive daily and weekly notable earnings alerts with predicted move