ajax loader

Loading...


Ride-the-Wave Strategy – Best for Stock Traders

Ride-the-Wave targets multi-day price momentum following a company’s earnings announcement (EA). With this strategy:

  1. Buy a stock one day post-EA if a stock reacts positively post-earnings:
    1. Near the close of trading the EA-day for a pre-market-EA
    2. Near the close of the following day for a post-market-EA
  2. Sell-to-close after 7-10 days, or possibly earlier if a desired price target is reached

Similarly,

  1. short a stock one day post-EA if a stock reacts negatively post-earnings:
    1. near the close of trading the EA-day for a premarket-EA
    2. near the close of the following day for a post-market-EA
  2. then buy-to-close after 7-10 days, or possibly earlier if a desired price target is reached

Important: Ride-the-Wave is predicated on significant price momentum triggered by an EA. The 7-10 day scenario is the maximum trade hold-time. If you see post EA-momentum is halted or reversed by a significant opposite move, re-evaluate your presence in the trade.

This popular StockEarnings screen below will give you a list of stocks that historically exhibit significant price momentum following an EA for the next seven days:

  1. Stocks exhibiting positive post-EA price moves are buy-candidates
  2. Stocks exhibiting negative post-EA price moves are sell/short-candidates

The screen includes those stocks whose Earnings just came out in last two days.

Screen criteria:

  1. Earnings Date Start Date : Current Date + -1 Day
  2. Earnings Date End Date : Current Date + -2 Days
  3. Predicted Move (Next Day) Max : 7%
  4. Predicted Move (On 7th Day) Min : 7%

Strategy Guideline:

  1. Buy the stock if stock has reacted positively. Short the stock if stock has reacted negatively (see above).
  2. Close the position in 7-10 days, or possibly earlier based on price move.

Volatility Crush Strategy - Best for Options Traders

The Volatility Crush strategy is used with stocks that typically experience relatively low-to-moderate price moves (≤4%) following their Earnings Announcements (EA). The basic trade idea is to sell put or call options right before the EA, collecting a credit when options premium is very high due to elevated implied volatility (IV). You then close the position right after the EA by buying the option back much cheaper due to the significant drop in IV that occurs after the mystery of the EA disappears. In assessing this trade, you need to do your homework to ensure you collect sufficient premium to make the trade worthwhile.

This trade is practical due to the low-to-moderate price-move after the EA, which generally won’t significantly affect the options price, unlike an “action” stock, which experience great price moves post-EA. With these symbols, if you’re on the right side of the price move, that’s a great thing. But if you’re on the wrong side of the move, not so great. Consequently, by minimizing the effect of the post-EA price move, you have a much better chance to profit from the reduction in IV without it being ruined by a violent price move.

For this trade, open the position either (1) the night before the EA when the company announces earnings or (2) during the EA day when it announces post-market, generally capturing IV at or close to its peak.

For this trade, open the position either (1) the night before the EA when the company announces earnings or (2) during the EA day when it announces post-market, generally capturing IV at or close to its peak.

This popular stockearnings screen will give you a list of stocks which do not react more than 4% fpost-EA. It includes only those stocks whose earnings are releasing next day.

Screen criteria:

  1. Earnings Date Start Date : Current Date + 1
  2. Earnings Date End Date : Current Date + 1
  3. Predicted Move (Next Day) Max : 4%
  4. Options Type: Weekly

Strategy Guideline:

  1. Options Strategy: Sell Call and Put
  2. Options Strike Price: Current Stock Price – (% Predicated Move x 2)
  3. Expiration Date: It should generally be the closest expiry immediately after the EA.
  4. Buy Insurance: Buying back Call and Put at Strike price which 10% lower than Sell Strike Price is optional but recommended.

Watch Video for More Detail

Volatility Rush Strategy - Best for Options Traders

The Volatility Rush takes advantage of increasing options premiums into earnings announcements (EA) caused by an anticipated rise in Implied Volatility (IV). With this strategy, Buy a Call and Put at-the-money (a long straddle) 2-3 weeks before the EA when IV is lower. Sell the position either (1) the night before the EA when the company announces earnings pre-market, or (2) during the EA day when it announces post-market, generally capturing IV at or close to its peak.

This popular screen will give you a list of stocks whose Options premiums tend to rise into Earnings. It includes only those stocks whose Earnings are at least two weeks away from today.

Screen criteria:

  1. Earnings Date Start Date : Current Date + 15 Days
  2. Earnings Date End Date : Current Date + 30 Days
  3. Predicted Move (Next Day) Min : 5%
  4. Options Type: Weekly or Monthly if that lines up with the two to three-week lead-time for entering the trade

Strategy Guideline:

  1. Buy a Straddle at or close to the money two to three weeks pre-EA.
  2. Sell the position either the night before the EA when the company announces earnings pre-market, or during the EA day when it announces post-market.
  3. Expiration date should generally be the closest expiry immediately after the EA.
  4. Straddle price should not be more 60% of predicted move.

Predicted Move (Volatility)

Similar to Implied Volatility in Options. Expected volatility % based on our Proprietary Volatility Predication Model. We are expecting that stock price will likely to reach % in either direction by the end of next trading session after Earnings are released and not necessarily the closing volatility %.

Why is it important?

    This indicator helps

  1. Knowing expected volatility in stocks after Earnings helps to decide trading stocks before Earnings Announcement.
  2. Taking Advantage of volatility collapse following Earnings Results by using Advance Options strategies such as Spread and Straddles.

Since Last Earnings

Change in share price since last Earnings release.

Why is it Important?

When share has gained more than 10% since it's last Earning release, it tends to over react to minor bad news and give up some gains if not all. So, it contains more downside volatility than upside When share has dropped more than 10% since it's last Earning release, it tends to over react to minor good news and recover some drops if not all. So, it contains more upside volatility than downside.

EPS Surprise (%)

Occurs when a company's reported quarterly or annual profits are above or below analysts' expectations. Here is the formula to derive % EPS Surprice:

Actual EPS - Estimated EPS
------------------------------------- x 100
Estimated EPS

Why is it Important?

Earnings surprises can have a huge impact on a company's stock price. Several studies suggest that positive earnings surprises not only lead to an immediate hike in a stock's price, but also to a gradual increase over time. Hence, it's not surprising that some companies are known for routinely beating earning projections. A negative earnings surprise will usually result in a decline in share price.

Next Day Price Change (%)

Next Regular trading session Closing price following Earnings result.

For After Market Close Earnings, It is a next trading day closing price. For Before Market Open Earnings, It is the same trading day closing price.

Why is it Important?

Next Day price change is a reaction of Earnings result.

Lennar Q3 Earnings Miss, But Was the Bad News Priced In?

Posted on Sep 17, 2026 by Chris Markoch

Lennar Q3 Earnings Miss, But Was the Bad News Priced In?

Lennar Corporation (NYSE: LEN) shares slid ahead of Wednesday’s earnings report, falling as much as 2% during the regular session. The Federal Reserve added another headwind, raising the Fed Funds Rate by 25 basis points earlier in the day. That move is expected to keep upward pressure on the 30-year mortgage rate, which is hovering near 7%.

For homebuilders already fighting an affordability crisis, the timing could not have been worse. And Lennar’s Q3 2026 earnings report won’t change that sentiment.

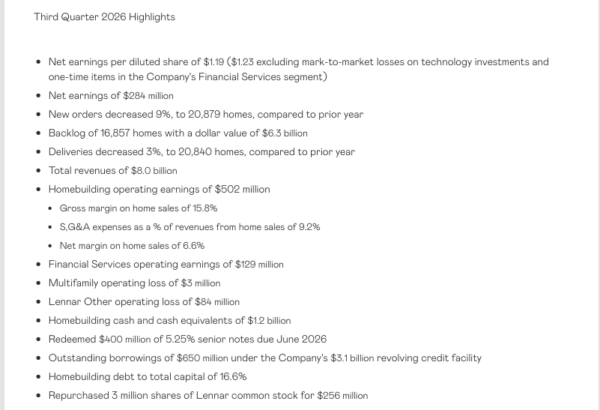
Lennar’s third-quarter results, released after Wednesday’s close, confirmed the concern. Net earnings attributable to the company came in at $284 million, or $1.19 per diluted share, compared to net earnings of $591 million, or $2.29 per diluted share, in the third quarter of 2025. Revenue fell to $8.05 billion from $8.81 billion a year earlier. Both figures landed short of Wall Street’s expectations

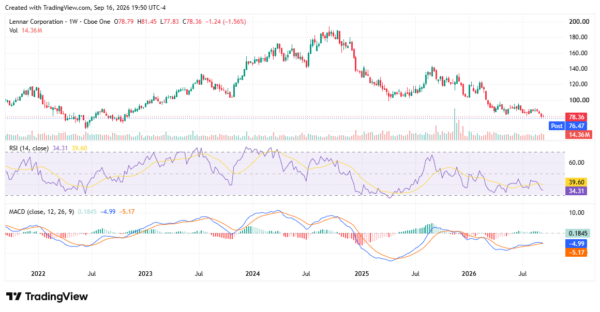
And yet the stock’s after-hours reaction was surprisingly muted. Shares dipped roughly 2.7% following the report. Given the scale of the miss, that decline looks almost restrained. That gap between the news and the reaction is worth investors’ attention.
lennar - StockEarnings

Lennar Earnings Miss as Revenue and Orders Decline


Lennar’s headline numbers tell a rough story. Adjusted earnings, which strip out mark-to-market losses and one-time items, came in at $1.23 per diluted share, well below the roughly $1.29-$1.30 analysts had modeled. Revenue of $8.05 billion also missed consensus estimates near $8.31 billion.

The operational details reinforce the margin pressure. Lennar delivered 20,840 homes during the quarter, down 3% from a year earlier, while new orders fell 9% to 20,879 homes. Backlog also shrank, standing at 16,857 homes valued at about $6.35 billion.

Costs crept higher, too. Selling, general and administrative expenses rose to 9.2% of home-sale revenue, up from 8.2% a year earlier, largely because lower volume left less room to spread fixed costs. Lennar has also leaned on price incentives to keep homes moving, which further compresses margins even as unit sales hold up better than pricing does.
lennar - StockEarnings

Taken together, this was a genuinely weak quarter. The Fed’s rate hike the same day added insult to injury, since higher rates typically translate into higher mortgage costs for buyers already priced out of many markets.

Was Lennar Stock’s Bad News Already Priced In?

Here’s the contrarian read. If Lennar’s numbers were this soft and the stock still fell only 2.7% after hours, the market may have already priced in a bad quarter. Lennar shares have been sliding for months, dropping from highs above $190 in 2024 to the high-$70s today. A lot of pessimism was already baked into the price before Wednesday’s print.

That doesn’t mean Lennar is in the clear. Margins remain under pressure, orders are falling, and higher long-term rates make the affordability math harder for buyers. But a mild post-earnings reaction after a genuinely disappointing quarter suggests expectations had already reset lower.

For a clearer read on housing sentiment, investors may want to look beyond Lennar. Watch how DR Horton (NYSE: DHI) and PulteGroup (NYSE: PHM) trade around their own reports. If those stocks hold up under similar pressure, it points to a sector-wide repricing rather than a Lennar-specific problem. If they fall harder, that signals investors see company-specific issues at Lennar. Either way, the builder group as a whole remains the better barometer for where housing sentiment truly stands right now.

Homebuilder Stocks Could Reveal Where Housing Goes Next

Given the uncertainty, some investors may prefer sector exposure over a single-stock bet. The SPDR S&P Homebuilders ETF (NYSEARCA: XHB) offers a diversified basket that spans builders, suppliers, and home-improvement retailers. That structure mitigates the risk of any one company’s earnings surprise while still capturing a rebound if housing sentiment improves.

Investors who want to stay adjacent to housing without owning a builder directly might also consider Home Depot (NYSE: HD) or Lowe’s (NYSE: LOW). Both companies benefit from renovation and repair spending, which tends to hold up even when new-home sales slow. Existing homeowners often improve rather than move when mortgage rates make relocating expensive, and that dynamic supports steady demand at both retailers.

There’s also a dividend angle worth noting. Home Depot and Lowe’s have both built long streaks of consistent payouts, offering income while investors wait out the housing cycle. That combination of defensive demand and shareholder returns makes both stocks a reasonable way to stay near the sector without betting directly on new construction.

None of these are risk-free trades. But for investors who “have to” stay involved in housing right now, spreading exposure across an ETF or adjacent retailers may be more prudent than concentrating risk in a single builder.

Lennar Earnings Raise Questions About the Housing Recovery

Lennar’s third quarter was weak by almost any measure. Earnings and revenue both missed estimates, orders declined, and margins compressed further. The Fed’s rate hike on the same day added another headwind for an industry already squeezed by affordability constraints.

Still, the stock’s relatively mild after-hours drop hints that much of this bad news was already reflected in the share price. Lennar has traded well below its 2024 highs for months, and a soft quarter met a market that wasn’t expecting much better.

That doesn’t make Lennar a clear buy or a clear avoid. Watch how DR Horton and PulteGroup trade in the days ahead for a broader read on housing sentiment. Ultimately, time will likely be the best indicator of whether Lennar’s stock has truly bottomed or if more downside lies ahead.


A former marketing copywriter turned freelance financial writer and market analyst. I have a passion for delivering insights to investors. I write regularly about stocks for StockEarnings and MarketBeat. Posts are not advice.

Join over 1.2M+ investors/traders who receive daily and weekly notable earnings alerts with predicted move