ajax loader

Loading...


Ride-the-Wave Strategy – Best for Stock Traders

Ride-the-Wave targets multi-day price momentum following a company’s earnings announcement (EA). With this strategy:

  1. Buy a stock one day post-EA if a stock reacts positively post-earnings:
    1. Near the close of trading the EA-day for a pre-market-EA
    2. Near the close of the following day for a post-market-EA
  2. Sell-to-close after 7-10 days, or possibly earlier if a desired price target is reached

Similarly,

  1. short a stock one day post-EA if a stock reacts negatively post-earnings:
    1. near the close of trading the EA-day for a premarket-EA
    2. near the close of the following day for a post-market-EA
  2. then buy-to-close after 7-10 days, or possibly earlier if a desired price target is reached

Important: Ride-the-Wave is predicated on significant price momentum triggered by an EA. The 7-10 day scenario is the maximum trade hold-time. If you see post EA-momentum is halted or reversed by a significant opposite move, re-evaluate your presence in the trade.

This popular StockEarnings screen below will give you a list of stocks that historically exhibit significant price momentum following an EA for the next seven days:

  1. Stocks exhibiting positive post-EA price moves are buy-candidates
  2. Stocks exhibiting negative post-EA price moves are sell/short-candidates

The screen includes those stocks whose Earnings just came out in last two days.

Screen criteria:

  1. Earnings Date Start Date : Current Date + -1 Day
  2. Earnings Date End Date : Current Date + -2 Days
  3. Predicted Move (Next Day) Max : 7%
  4. Predicted Move (On 7th Day) Min : 7%

Strategy Guideline:

  1. Buy the stock if stock has reacted positively. Short the stock if stock has reacted negatively (see above).
  2. Close the position in 7-10 days, or possibly earlier based on price move.

Volatility Crush Strategy - Best for Options Traders

The Volatility Crush strategy is used with stocks that typically experience relatively low-to-moderate price moves (≤4%) following their Earnings Announcements (EA). The basic trade idea is to sell put or call options right before the EA, collecting a credit when options premium is very high due to elevated implied volatility (IV). You then close the position right after the EA by buying the option back much cheaper due to the significant drop in IV that occurs after the mystery of the EA disappears. In assessing this trade, you need to do your homework to ensure you collect sufficient premium to make the trade worthwhile.

This trade is practical due to the low-to-moderate price-move after the EA, which generally won’t significantly affect the options price, unlike an “action” stock, which experience great price moves post-EA. With these symbols, if you’re on the right side of the price move, that’s a great thing. But if you’re on the wrong side of the move, not so great. Consequently, by minimizing the effect of the post-EA price move, you have a much better chance to profit from the reduction in IV without it being ruined by a violent price move.

For this trade, open the position either (1) the night before the EA when the company announces earnings or (2) during the EA day when it announces post-market, generally capturing IV at or close to its peak.

For this trade, open the position either (1) the night before the EA when the company announces earnings or (2) during the EA day when it announces post-market, generally capturing IV at or close to its peak.

This popular stockearnings screen will give you a list of stocks which do not react more than 4% fpost-EA. It includes only those stocks whose earnings are releasing next day.

Screen criteria:

  1. Earnings Date Start Date : Current Date + 1
  2. Earnings Date End Date : Current Date + 1
  3. Predicted Move (Next Day) Max : 4%
  4. Options Type: Weekly

Strategy Guideline:

  1. Options Strategy: Sell Call and Put
  2. Options Strike Price: Current Stock Price – (% Predicated Move x 2)
  3. Expiration Date: It should generally be the closest expiry immediately after the EA.
  4. Buy Insurance: Buying back Call and Put at Strike price which 10% lower than Sell Strike Price is optional but recommended.

Watch Video for More Detail

Volatility Rush Strategy - Best for Options Traders

The Volatility Rush takes advantage of increasing options premiums into earnings announcements (EA) caused by an anticipated rise in Implied Volatility (IV). With this strategy, Buy a Call and Put at-the-money (a long straddle) 2-3 weeks before the EA when IV is lower. Sell the position either (1) the night before the EA when the company announces earnings pre-market, or (2) during the EA day when it announces post-market, generally capturing IV at or close to its peak.

This popular screen will give you a list of stocks whose Options premiums tend to rise into Earnings. It includes only those stocks whose Earnings are at least two weeks away from today.

Screen criteria:

  1. Earnings Date Start Date : Current Date + 15 Days
  2. Earnings Date End Date : Current Date + 30 Days
  3. Predicted Move (Next Day) Min : 5%
  4. Options Type: Weekly or Monthly if that lines up with the two to three-week lead-time for entering the trade

Strategy Guideline:

  1. Buy a Straddle at or close to the money two to three weeks pre-EA.
  2. Sell the position either the night before the EA when the company announces earnings pre-market, or during the EA day when it announces post-market.
  3. Expiration date should generally be the closest expiry immediately after the EA.
  4. Straddle price should not be more 60% of predicted move.

Predicted Move (Volatility)

Similar to Implied Volatility in Options. Expected volatility % based on our Proprietary Volatility Predication Model. We are expecting that stock price will likely to reach % in either direction by the end of next trading session after Earnings are released and not necessarily the closing volatility %.

Why is it important?

    This indicator helps

  1. Knowing expected volatility in stocks after Earnings helps to decide trading stocks before Earnings Announcement.
  2. Taking Advantage of volatility collapse following Earnings Results by using Advance Options strategies such as Spread and Straddles.

Since Last Earnings

Change in share price since last Earnings release.

Why is it Important?

When share has gained more than 10% since it's last Earning release, it tends to over react to minor bad news and give up some gains if not all. So, it contains more downside volatility than upside When share has dropped more than 10% since it's last Earning release, it tends to over react to minor good news and recover some drops if not all. So, it contains more upside volatility than downside.

EPS Surprise (%)

Occurs when a company's reported quarterly or annual profits are above or below analysts' expectations. Here is the formula to derive % EPS Surprice:

Actual EPS - Estimated EPS
------------------------------------- x 100
Estimated EPS

Why is it Important?

Earnings surprises can have a huge impact on a company's stock price. Several studies suggest that positive earnings surprises not only lead to an immediate hike in a stock's price, but also to a gradual increase over time. Hence, it's not surprising that some companies are known for routinely beating earning projections. A negative earnings surprise will usually result in a decline in share price.

Next Day Price Change (%)

Next Regular trading session Closing price following Earnings result.

For After Market Close Earnings, It is a next trading day closing price. For Before Market Open Earnings, It is the same trading day closing price.

Why is it Important?

Next Day price change is a reaction of Earnings result.

The $6 Diesel Shock Is Moving Straight Into Your Food Bill 

Posted on Sep 17, 2026 by Grayson Cavern

The $6 Diesel Shock Is Moving Straight Into Your Food Bill 

The grocery bill is one of the last places an agricultural inflation shock shows up, and that lag is exactly why investors should be watching the food chain now. Americans are already paying for the oil shock at the pump as U.S. diesel just crossed $6 a gallon for the first time, nearly 60% above February levels. Meanwhile, August CPI showed energy prices up 16.3% year over year, while food was up only 2.7%, with food at home completely flat for the month. 

That’s where this starts getting dicey for the food economy. The numbers coming out of the fields are already moving, but the price Americans pay for the finished product hasn’t caught up yet. There is a whole lot of economics sitting between those two points, and some of it is already showing signs that the diesel shock is going to travel a lot further than the gas tank. 

The Diesel Shock Has Already Reached The Farm


Diesel doesn’t stop at the gas station. It runs tractors, combines, trucks and the freight network moving crops from farms to processors, distributors and stores. Wells Fargo Investment Institute’s latest data shows diesel up 57% year to date through August 31, while wheat jumped 47%, soybean oil 47%, soybeans 24%, corn 16% and fertilizer 13%. Those are market prices moving through the agricultural complex, but not yet being seen on the grocery shelf. 

CME Group’s August agriculture index rose 6.37% in one month and 16.16% year to date, with Chicago wheat up 17.91% and corn 15.82% in August alone. CME also says diesel in major U.S. commodity-growing regions has surged more than 40% since the war began, squeezing farm margins alongside fertilizer costs. 

This is where the chain gets ugly for farmers: they cannot just switch off fuel or fertilizer when prices explode, since those inputs determine whether the crop gets planted, harvested and transported in the first place. Corteva’s management has already discussed fertilizer prices influencing the economics of corn versus soybeans and keeping Safrinha corn acreage flat rather than expanding it. 

Fertilizer Could Turn An Oil Problem Into A Food Problem

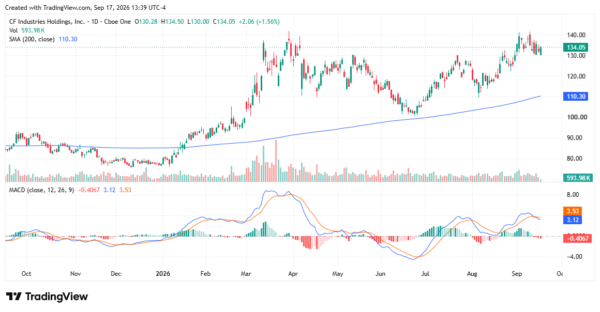
CF Industries (NYSE: CF) is already showing what happens upstream when the squeeze reaches nitrogen. In the first half of 2026, CF’s average UAN selling price jumped to $391 per product ton from $286 a year earlier, while adjusted gross margin per ton climbed to $234 from $148. 

That is a huge clue for the food thesis because fertilizer is an input into the crop, not the final product. If farmers face higher fertilizer and diesel bills, they need stronger crop economics to justify planting decisions. If commodity prices rise enough to compensate, that cost gets embedded further down the chain. If they do not, acreage, yields or farm profitability take the hit.
diesel - StockEarnings

The Grocery Store Is The Last Place You’ll See It

After the farm comes the processor, food manufacturer, distributor and retailer. Companies such as Tyson Foods (NYSE: TSN) are already dealing with commodity pressure; Tyson said its prepared-foods business had experienced commodity inflation in seven of the previous eight quarters, while beef supplies remained tight. That is, before another full wave of energy and transportation costs works through the system.

Then you get to retailers like Walmart (NYSE: WMT), which is the clearest example of how fuel can hit margins before consumers see the full impact: rising fuel costs reduced its first-quarter operating income by about $175 million, largely through delivery and fulfillment costs, and Walmart’s CFO warned that persistently elevated costs could produce higher retail price inflation later in 2026. 

Restaurants have an even tighter squeeze because they sit at the end of several cost pipelines simultaneously. McDonald’s (NYSE: MCD), Domino’s Pizza (NYSE: DPZ) and other chains have to manage food ingredients, distribution, packaging, labor and delivery economics while customers are already pushing back against higher menu prices. The August CPI data shows food away from home running at 3.4% year over year, faster than food at home’s 2.2%, with full-service meals up 3.5%. 

Someone Has To Eat The Bill

That is the part I think investors are missing when they look at today’s grocery inflation and conclude the food shock is contained. The consumer price data tells us what has already made it through the pipeline. Commodity markets are showing what is moving through the pipeline now.

There are several places where that bill can land. Farmers can absorb higher input costs. Processors can accept narrower margins. Restaurants can raise menu prices and risk losing traffic. Retailers can protect shoppers and sacrifice margin. Or companies with enough pricing power can push costs downstream.

That creates very different setups across the food economy. CF Industries can benefit from stronger fertilizer pricing. Corteva has to manage the farmers’ economics. Tyson Foods faces expensive cattle and commodity inputs. Walmart has to defend low prices while absorbing distribution costs. Restaurants such as McDonald’s have to balance menu pricing against traffic.

What I’m Watching

That’s why I’m not looking at this as a simple food-inflation trade. The bigger setup is what happens when an energy shock collides with an agricultural system already carrying higher input costs, and then works its way through businesses with very different amounts of room to absorb it.

For the next few quarters, I’d be watching gross margins, pricing actions and management guidance across the food chain more closely than the headline food CPI. If those margins start to deteriorate as companies push through higher prices, we’ll have a much clearer read on who is actually paying for this oil shock. 

.

Join over 1.2M+ investors/traders who receive daily and weekly notable earnings alerts with predicted move
