ajax loader

Loading...


Ride-the-Wave Strategy – Best for Stock Traders

Ride-the-Wave targets multi-day price momentum following a company’s earnings announcement (EA). With this strategy:

  1. Buy a stock one day post-EA if a stock reacts positively post-earnings:
    1. Near the close of trading the EA-day for a pre-market-EA
    2. Near the close of the following day for a post-market-EA
  2. Sell-to-close after 7-10 days, or possibly earlier if a desired price target is reached

Similarly,

  1. short a stock one day post-EA if a stock reacts negatively post-earnings:
    1. near the close of trading the EA-day for a premarket-EA
    2. near the close of the following day for a post-market-EA
  2. then buy-to-close after 7-10 days, or possibly earlier if a desired price target is reached

Important: Ride-the-Wave is predicated on significant price momentum triggered by an EA. The 7-10 day scenario is the maximum trade hold-time. If you see post EA-momentum is halted or reversed by a significant opposite move, re-evaluate your presence in the trade.

This popular StockEarnings screen below will give you a list of stocks that historically exhibit significant price momentum following an EA for the next seven days:

  1. Stocks exhibiting positive post-EA price moves are buy-candidates
  2. Stocks exhibiting negative post-EA price moves are sell/short-candidates

The screen includes those stocks whose Earnings just came out in last two days.

Screen criteria:

  1. Earnings Date Start Date : Current Date + -1 Day
  2. Earnings Date End Date : Current Date + -2 Days
  3. Predicted Move (Next Day) Max : 7%
  4. Predicted Move (On 7th Day) Min : 7%

Strategy Guideline:

  1. Buy the stock if stock has reacted positively. Short the stock if stock has reacted negatively (see above).
  2. Close the position in 7-10 days, or possibly earlier based on price move.

Volatility Crush Strategy - Best for Options Traders

The Volatility Crush strategy is used with stocks that typically experience relatively low-to-moderate price moves (≤4%) following their Earnings Announcements (EA). The basic trade idea is to sell put or call options right before the EA, collecting a credit when options premium is very high due to elevated implied volatility (IV). You then close the position right after the EA by buying the option back much cheaper due to the significant drop in IV that occurs after the mystery of the EA disappears. In assessing this trade, you need to do your homework to ensure you collect sufficient premium to make the trade worthwhile.

This trade is practical due to the low-to-moderate price-move after the EA, which generally won’t significantly affect the options price, unlike an “action” stock, which experience great price moves post-EA. With these symbols, if you’re on the right side of the price move, that’s a great thing. But if you’re on the wrong side of the move, not so great. Consequently, by minimizing the effect of the post-EA price move, you have a much better chance to profit from the reduction in IV without it being ruined by a violent price move.

For this trade, open the position either (1) the night before the EA when the company announces earnings or (2) during the EA day when it announces post-market, generally capturing IV at or close to its peak.

For this trade, open the position either (1) the night before the EA when the company announces earnings or (2) during the EA day when it announces post-market, generally capturing IV at or close to its peak.

This popular stockearnings screen will give you a list of stocks which do not react more than 4% fpost-EA. It includes only those stocks whose earnings are releasing next day.

Screen criteria:

  1. Earnings Date Start Date : Current Date + 1
  2. Earnings Date End Date : Current Date + 1
  3. Predicted Move (Next Day) Max : 4%
  4. Options Type: Weekly

Strategy Guideline:

  1. Options Strategy: Sell Call and Put
  2. Options Strike Price: Current Stock Price – (% Predicated Move x 2)
  3. Expiration Date: It should generally be the closest expiry immediately after the EA.
  4. Buy Insurance: Buying back Call and Put at Strike price which 10% lower than Sell Strike Price is optional but recommended.

Watch Video for More Detail

Volatility Rush Strategy - Best for Options Traders

The Volatility Rush takes advantage of increasing options premiums into earnings announcements (EA) caused by an anticipated rise in Implied Volatility (IV). With this strategy, Buy a Call and Put at-the-money (a long straddle) 2-3 weeks before the EA when IV is lower. Sell the position either (1) the night before the EA when the company announces earnings pre-market, or (2) during the EA day when it announces post-market, generally capturing IV at or close to its peak.

This popular screen will give you a list of stocks whose Options premiums tend to rise into Earnings. It includes only those stocks whose Earnings are at least two weeks away from today.

Screen criteria:

  1. Earnings Date Start Date : Current Date + 15 Days
  2. Earnings Date End Date : Current Date + 30 Days
  3. Predicted Move (Next Day) Min : 5%
  4. Options Type: Weekly or Monthly if that lines up with the two to three-week lead-time for entering the trade

Strategy Guideline:

  1. Buy a Straddle at or close to the money two to three weeks pre-EA.
  2. Sell the position either the night before the EA when the company announces earnings pre-market, or during the EA day when it announces post-market.
  3. Expiration date should generally be the closest expiry immediately after the EA.
  4. Straddle price should not be more 60% of predicted move.

Predicted Move (Volatility)

Similar to Implied Volatility in Options. Expected volatility % based on our Proprietary Volatility Predication Model. We are expecting that stock price will likely to reach % in either direction by the end of next trading session after Earnings are released and not necessarily the closing volatility %.

Why is it important?

    This indicator helps

  1. Knowing expected volatility in stocks after Earnings helps to decide trading stocks before Earnings Announcement.
  2. Taking Advantage of volatility collapse following Earnings Results by using Advance Options strategies such as Spread and Straddles.

Since Last Earnings

Change in share price since last Earnings release.

Why is it Important?

When share has gained more than 10% since it's last Earning release, it tends to over react to minor bad news and give up some gains if not all. So, it contains more downside volatility than upside When share has dropped more than 10% since it's last Earning release, it tends to over react to minor good news and recover some drops if not all. So, it contains more upside volatility than downside.

EPS Surprise (%)

Occurs when a company's reported quarterly or annual profits are above or below analysts' expectations. Here is the formula to derive % EPS Surprice:

Actual EPS - Estimated EPS
------------------------------------- x 100
Estimated EPS

Why is it Important?

Earnings surprises can have a huge impact on a company's stock price. Several studies suggest that positive earnings surprises not only lead to an immediate hike in a stock's price, but also to a gradual increase over time. Hence, it's not surprising that some companies are known for routinely beating earning projections. A negative earnings surprise will usually result in a decline in share price.

Next Day Price Change (%)

Next Regular trading session Closing price following Earnings result.

For After Market Close Earnings, It is a next trading day closing price. For Before Market Open Earnings, It is the same trading day closing price.

Why is it Important?

Next Day price change is a reaction of Earnings result.

Copart Q4 Earnings Reveal Expensive Cars Are Becoming Its Best Customers

Posted on Sep 17, 2026 by Grayson Cavern

Copart Q4 Earnings Reveal Expensive Cars Are Becoming Its Best Customers

When Henry Ford’s Model T put millions behind the wheel, a damaged car was mostly a mechanical problem: fix the part and get back on the road. A century later, Copart management, during its Q4 2026 earnings, pointed to Tesla’s roughly 100 million lines of software code as evidence of modern vehicle complexity.

That sounds like a tech story, but it is becoming a Copart, Inc. (NASDAQ: CPRT) story: the more expensive cars become to repair, the easier it becomes for insurers to total them. That’s exactly what I’m seeing in the latest numbers. Copart sold 2.9% fewer vehicles globally, yet revenue still climbed 2.4% to $1.15 billion, global average selling prices increased 3.5%, and revenue per unit jumped 5.4%.

So don’t just look at the unit decline this quarter and write CPRT off as a volume story. There’s something else happening underneath it.

Expensive Cars Are Changing The Math Of A Total Loss


Copart’s business is tied to wrecks, but the number that really drives its inventory is the point at which an insurer decides that repairing a wreck no longer makes economic sense. That threshold is shifting.

Collision claim frequency fell 3.4% year over year, helping drive a 7.5% decline in U.S. insurance units. But total-loss frequency reached 23.3% in Q2 2026, the highest second-quarter level in Copart’s history, up from 22.4% a year earlier. Average collision severity jumped nearly 8.8% to more than $6,300, its fourth straight quarter of acceleration, while repair costs are more than 50% above 2019 levels, according to CCC data cited by management.

However, even with fewer accidents, there can still be a healthy salvage pool if the accidents that do happen become expensive enough to total more vehicles.

When those vehicles hit the auction block, Copart is getting more money out of them. U.S. insurance ASP rose 3.7% in Q4, U.S. non-insurance ASP 5.9%, bank and finance seller ASPs 12.4% year to date, and Copart Direct ASP 29.2%. Yeah, volume is softer, but value per vehicle is doing the heavy lifting here.

Buyer Network Is Becoming More Valuable Than Its Vehicle Count

This is where the tape can fool you if you only watch unit growth. Copart isn’t a manufacturer that needs to produce more inventory. It runs a marketplace where buyer depth changes the economics of the inventory already sitting there.

International buyers accounted for 38.2% of U.S. units sold in fiscal 2026, but 45.7% of the dollars spent. They’re punching above their weight. International units grew 10% in Q4, international insurance units increased 11.2%, U.S. dealer units climbed 5.8%, and BluCar, serving bank, rental and fleet partners, grew nearly 20%.

So I’m not looking at a business that needs accident frequency to bounce. Copart is broadening supply and demand, then using that liquidity to squeeze more value out of every vehicle moving through the platform.

Then Copart Bought The Cars That Never Become Salvage

This is where the $1.9 billion acquisition of ACV Auctions Inc. (NYSE: ACVA) makes a lot more sense.

Copart agreed to buy ACV Auctions for $10.50 per share in cash, valuing the deal at about $1.9 billion. ACV processed roughly $10 billion of gross merchandise value in 2025, with more than 22,000 active buyers.

Its traditional business gets involved after an insurer decides a vehicle is economically totaled. ACV gives Copart exposure to vehicles that are still perfectly usable but moving through the wholesale market.

Management says the combination creates a broader remarketing platform spanning dealer trade-ins, wholesale, salvage and international resale, backed by Copart’s physical footprint and buyer network.

That’s bigger than waiting for insurance claims to recover since Copart is trying to capture more of a vehicle’s life before it reaches the salvage yard.

The Market Still Has A Problem With The Bill

I’d pump the brakes on the bull case here. Copart is spending heavily to build the next version of the company. Fourth-quarter gross profit fell 5.5% to $481.4 million even as revenue rose 2.4%, while operating income dropped 10.6% to $368.9 million and EPS fell 14.6% to $0.35.

Operating expense per car increased by 12.7%, partly due to investments in long-haul delivery, Title Express, technology and wholesale facilities. That’s the bet: spending comes before the payoff. The ACV deal is expected to be neutral to EPS in the first full year and accretive in fiscal 2028 and beyond.

If ACV, international growth, higher-value salvage and buyer liquidity push enough vehicles through the network, today’s margin pressure can look like investment spending in hindsight. If not, the margin compression gets harder to ignore.

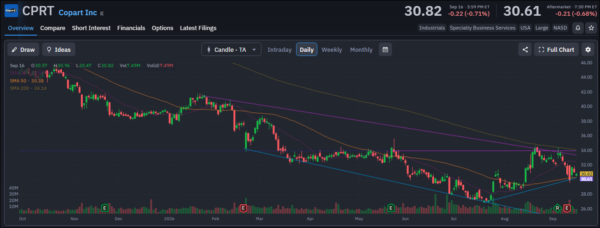
The chart gives us a clean level to watch. CPRT is around $30.82, near its 50-day SMA at $30.38, but below the 20-day and 200-day averages of around $34.5.

So $30 is the first line in the sand. Reclaim $34–35, and the chart starts confirming the fundamental story.
copart - StockEarnings

Where I Want Copart Next

I like what Copart is building, but I’m not buying because CPRT has pulled back. Rising repair costs are a tailwind, while the buyer network extracts more value per vehicle. ACV Auctions Inc. adds exposure to vehicles that never become salvage.

But the market still needs to see spending translate into earnings, and the chart is sitting on support rather than breaking higher. I’ll take the trade when CPRT takes back $34–35. Until then, I’m watching whether repair costs turn into earnings.


Join over 1.2M+ investors/traders who receive daily and weekly notable earnings alerts with predicted move