ajax loader

Loading...


Ride-the-Wave Strategy – Best for Stock Traders

Ride-the-Wave targets multi-day price momentum following a company’s earnings announcement (EA). With this strategy:

  1. Buy a stock one day post-EA if a stock reacts positively post-earnings:
    1. Near the close of trading the EA-day for a pre-market-EA
    2. Near the close of the following day for a post-market-EA
  2. Sell-to-close after 7-10 days, or possibly earlier if a desired price target is reached

Similarly,

  1. short a stock one day post-EA if a stock reacts negatively post-earnings:
    1. near the close of trading the EA-day for a premarket-EA
    2. near the close of the following day for a post-market-EA
  2. then buy-to-close after 7-10 days, or possibly earlier if a desired price target is reached

Important: Ride-the-Wave is predicated on significant price momentum triggered by an EA. The 7-10 day scenario is the maximum trade hold-time. If you see post EA-momentum is halted or reversed by a significant opposite move, re-evaluate your presence in the trade.

This popular StockEarnings screen below will give you a list of stocks that historically exhibit significant price momentum following an EA for the next seven days:

  1. Stocks exhibiting positive post-EA price moves are buy-candidates
  2. Stocks exhibiting negative post-EA price moves are sell/short-candidates

The screen includes those stocks whose Earnings just came out in last two days.

Screen criteria:

  1. Earnings Date Start Date : Current Date + -1 Day
  2. Earnings Date End Date : Current Date + -2 Days
  3. Predicted Move (Next Day) Max : 7%
  4. Predicted Move (On 7th Day) Min : 7%

Strategy Guideline:

  1. Buy the stock if stock has reacted positively. Short the stock if stock has reacted negatively (see above).
  2. Close the position in 7-10 days, or possibly earlier based on price move.

Volatility Crush Strategy - Best for Options Traders

The Volatility Crush strategy is used with stocks that typically experience relatively low-to-moderate price moves (≤4%) following their Earnings Announcements (EA). The basic trade idea is to sell put or call options right before the EA, collecting a credit when options premium is very high due to elevated implied volatility (IV). You then close the position right after the EA by buying the option back much cheaper due to the significant drop in IV that occurs after the mystery of the EA disappears. In assessing this trade, you need to do your homework to ensure you collect sufficient premium to make the trade worthwhile.

This trade is practical due to the low-to-moderate price-move after the EA, which generally won’t significantly affect the options price, unlike an “action” stock, which experience great price moves post-EA. With these symbols, if you’re on the right side of the price move, that’s a great thing. But if you’re on the wrong side of the move, not so great. Consequently, by minimizing the effect of the post-EA price move, you have a much better chance to profit from the reduction in IV without it being ruined by a violent price move.

For this trade, open the position either (1) the night before the EA when the company announces earnings or (2) during the EA day when it announces post-market, generally capturing IV at or close to its peak.

For this trade, open the position either (1) the night before the EA when the company announces earnings or (2) during the EA day when it announces post-market, generally capturing IV at or close to its peak.

This popular stockearnings screen will give you a list of stocks which do not react more than 4% fpost-EA. It includes only those stocks whose earnings are releasing next day.

Screen criteria:

  1. Earnings Date Start Date : Current Date + 1
  2. Earnings Date End Date : Current Date + 1
  3. Predicted Move (Next Day) Max : 4%
  4. Options Type: Weekly

Strategy Guideline:

  1. Options Strategy: Sell Call and Put
  2. Options Strike Price: Current Stock Price – (% Predicated Move x 2)
  3. Expiration Date: It should generally be the closest expiry immediately after the EA.
  4. Buy Insurance: Buying back Call and Put at Strike price which 10% lower than Sell Strike Price is optional but recommended.

Watch Video for More Detail

Volatility Rush Strategy - Best for Options Traders

The Volatility Rush takes advantage of increasing options premiums into earnings announcements (EA) caused by an anticipated rise in Implied Volatility (IV). With this strategy, Buy a Call and Put at-the-money (a long straddle) 2-3 weeks before the EA when IV is lower. Sell the position either (1) the night before the EA when the company announces earnings pre-market, or (2) during the EA day when it announces post-market, generally capturing IV at or close to its peak.

This popular screen will give you a list of stocks whose Options premiums tend to rise into Earnings. It includes only those stocks whose Earnings are at least two weeks away from today.

Screen criteria:

  1. Earnings Date Start Date : Current Date + 15 Days
  2. Earnings Date End Date : Current Date + 30 Days
  3. Predicted Move (Next Day) Min : 5%
  4. Options Type: Weekly or Monthly if that lines up with the two to three-week lead-time for entering the trade

Strategy Guideline:

  1. Buy a Straddle at or close to the money two to three weeks pre-EA.
  2. Sell the position either the night before the EA when the company announces earnings pre-market, or during the EA day when it announces post-market.
  3. Expiration date should generally be the closest expiry immediately after the EA.
  4. Straddle price should not be more 60% of predicted move.

Predicted Move (Volatility)

Similar to Implied Volatility in Options. Expected volatility % based on our Proprietary Volatility Predication Model. We are expecting that stock price will likely to reach % in either direction by the end of next trading session after Earnings are released and not necessarily the closing volatility %.

Why is it important?

    This indicator helps

  1. Knowing expected volatility in stocks after Earnings helps to decide trading stocks before Earnings Announcement.
  2. Taking Advantage of volatility collapse following Earnings Results by using Advance Options strategies such as Spread and Straddles.

Since Last Earnings

Change in share price since last Earnings release.

Why is it Important?

When share has gained more than 10% since it's last Earning release, it tends to over react to minor bad news and give up some gains if not all. So, it contains more downside volatility than upside When share has dropped more than 10% since it's last Earning release, it tends to over react to minor good news and recover some drops if not all. So, it contains more upside volatility than downside.

EPS Surprise (%)

Occurs when a company's reported quarterly or annual profits are above or below analysts' expectations. Here is the formula to derive % EPS Surprice:

Actual EPS - Estimated EPS
------------------------------------- x 100
Estimated EPS

Why is it Important?

Earnings surprises can have a huge impact on a company's stock price. Several studies suggest that positive earnings surprises not only lead to an immediate hike in a stock's price, but also to a gradual increase over time. Hence, it's not surprising that some companies are known for routinely beating earning projections. A negative earnings surprise will usually result in a decline in share price.

Next Day Price Change (%)

Next Regular trading session Closing price following Earnings result.

For After Market Close Earnings, It is a next trading day closing price. For Before Market Open Earnings, It is the same trading day closing price.

Why is it Important?

Next Day price change is a reaction of Earnings result.

The Great Divergence Inside Trip.com’s Q2 Earnings You Shouldn’t Miss

Posted on Sep 16, 2026 by Grayson Cavern

The Great Divergence Inside Trip.com’s Q2 Earnings You Shouldn’t Miss

Trip.com Group Ltd. (NASDAQ: TCOM) just gave us one of those earnings reports where the headline numbers can send you looking in the wrong direction. Revenue was up 6% year over year to RMB15.7 billion ($2.34 billion), and non-GAAP diluted EPS came in at RMB7.27, or $1.07, versus RMB7.20 ($1.07) a year ago.

That’s a solid quarter. But the number that’s keeping me awake is the 50%+ jump in international platform revenue

That’s a massive gap between what’s happening inside the overall business and what’s happening inside the piece Trip.com is trying to build for the next leg of growth. And if you’re looking at the stock, you need to understand that gap before deciding what to do with TCOM.

The ugly headline is the RMB5.2 billion ($780 million) anti-monopoly penalty from China’s State Administration for Market Regulation (SAMR), which pushed Trip.com into a net loss of RMB2.4 billion ($360 million) versus RMB4.9 billion ($730 million) in net income a year ago. But strip out that penalty, and the company would have posted RMB2.7 billion ($400 million) of net income.

So, yes, the GAAP number looks underwhelming. But if you’re trading the underlying business rather than the accounting noise, there’s a much more interesting setup here.

International Trip.com Is Already Growing Like A Different Company


Look at the revenue breakdown and the divergence jumps right off the page.

Trip.com’s total revenue grew 6%, but international platform revenue grew more than 50%. Management also said inbound travel revenue increased at a high-double-digit rate.

That’s not a small difference.

  • Accommodation revenue was up 6% to RMB6.6 billion($980 million).
  • Packaged tours grew 8% to RMB1.2 billion ($180 million).
  • Corporate travel jumped 11% to RMB771 million ($114.96 million).

Transportation was the weak spot, with revenue down 1% year over year to RMB5.4 billion ($810 million) and 12% sequentially, as higher energy prices and geopolitical volatility hit the business.

Then you get into the international numbers, and things start looking very different.

First- and business-class flight bookings on Trip.com were up more than 70% year over year in the first half, while customized tour bookings exploded 600%. 

Now, I’m not saying you take that 50% growth rate and slap it onto the next five years. That’s not how this works. But the divergence is real.

The company is growing 6% at the top level while the international platform is growing 50%+. That’s the part I’d keep on the screen.

The Fine Changes The Domestic Economics, Not Just The Quarter

Here’s where I’d be careful if you’re looking at TCOM and thinking, “Easy. The fine is one-time, so just ignore it.”

I wouldn’t go that far. The SAMR penalty totaled RMB5.18 billion ($770 million), including a RMB3.52 billion ($520 million) fine and RMB1.66 billion (250 million) in confiscated gains. It also created a contra-revenue impact in accommodation reservation revenue. Without that impact, Trip.com said accommodation revenue would have grown 8% instead of 6%.

The bigger issue is what happens to the business after the charge disappears.

SAMR’s decision forces Trip.com to change parts of how it works with hotel partners, and management said the company is changing its hotel framework around value, transparency, service quality and product competitiveness.

So there’s a real reset happening inside the China business. At the same time, it is spending more to push internationally. Sales and marketing expenses climbed 15% year over year, while adjusted EBITDA fell to RMB4.6 billion ($690 million) from RMB4.9 billion ($730 million). That’s the trade-off I’m watching.

Then AI Enters The Equation

TCOM isn’t just throwing AI into the earnings call because every public company feels obligated to mention it. There are actual transaction numbers here. AI-assisted orders through TripGenie increased about 400% year over year, and nearly 60% of TripGenie’s interactions are now booking-related across hotels, flights and attractions.

That’s worth watching. Because Trip.com doesn’t need to build the next ChatGPT to benefit from AI in travel. If AI gets people to search for trips differently, somebody still has to actually sell the hotel room, book the flight, provide the inventory, process the transaction and handle the customer.

Trip.com already has that infrastructure. So I think the interesting AI angle here is less “Trip.com is an AI company” and more AI could make Trip.com’s existing travel infrastructure more valuable.

The Stock Still Looks Like It Needs Proof

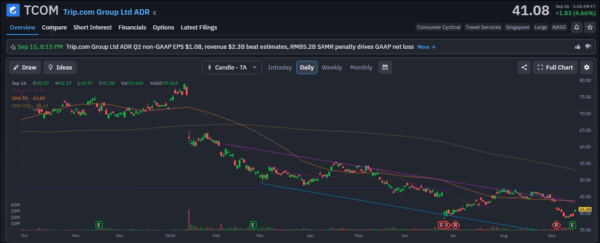
TCOM is around $41.08, sitting below the 20-day SMA at roughly $42.88 and the 50-day SMA at around $43.89. The 200-day SMA is way up near $53.15.

And the bigger picture isn’t pretty. The stock has fallen from roughly $78 earlier this year into the low $40s, leaving us with a pretty obvious series of lower highs and lower lows.

So if you’re trading this, I’m not chasing the earnings pop. The first level I’d watch is that $43–44 zone. Get back above the 20-day and 50-day averages and you’ve got the first sign that buyers are actually stepping back in. Then I’d watch the $48 area, with the 200-day around $53–54 as the bigger test.

Until TCOM starts reclaiming those levels, the chart is basically saying: show me.
trip.com - StockEarnings

Not Buying Yet

And that’s where I land on it.

Trip.com is clearly more interesting than the 6% headline growth suggests. But I’m not buying simply because the numbers underneath the GAAP loss look better.

You’ve got a domestic business going through a regulatory reset, heavier spending on international expansion, and adjusted EBITDA still moving lower.

The story I want to see play out is pretty simple: can that 50%+ international growth become large enough to move the economics of the entire company?

If it can, TCOM could eventually give the chart something worth buying. Right now, I’m waiting for the chart to start agreeing with the story.


Join over 1.2M+ investors/traders who receive daily and weekly notable earnings alerts with predicted move