ajax loader

Loading...


Ride-the-Wave Strategy – Best for Stock Traders

Ride-the-Wave targets multi-day price momentum following a company’s earnings announcement (EA). With this strategy:

  1. Buy a stock one day post-EA if a stock reacts positively post-earnings:
    1. Near the close of trading the EA-day for a pre-market-EA
    2. Near the close of the following day for a post-market-EA
  2. Sell-to-close after 7-10 days, or possibly earlier if a desired price target is reached

Similarly,

  1. short a stock one day post-EA if a stock reacts negatively post-earnings:
    1. near the close of trading the EA-day for a premarket-EA
    2. near the close of the following day for a post-market-EA
  2. then buy-to-close after 7-10 days, or possibly earlier if a desired price target is reached

Important: Ride-the-Wave is predicated on significant price momentum triggered by an EA. The 7-10 day scenario is the maximum trade hold-time. If you see post EA-momentum is halted or reversed by a significant opposite move, re-evaluate your presence in the trade.

This popular StockEarnings screen below will give you a list of stocks that historically exhibit significant price momentum following an EA for the next seven days:

  1. Stocks exhibiting positive post-EA price moves are buy-candidates
  2. Stocks exhibiting negative post-EA price moves are sell/short-candidates

The screen includes those stocks whose Earnings just came out in last two days.

Screen criteria:

  1. Earnings Date Start Date : Current Date + -1 Day
  2. Earnings Date End Date : Current Date + -2 Days
  3. Predicted Move (Next Day) Max : 7%
  4. Predicted Move (On 7th Day) Min : 7%

Strategy Guideline:

  1. Buy the stock if stock has reacted positively. Short the stock if stock has reacted negatively (see above).
  2. Close the position in 7-10 days, or possibly earlier based on price move.

Volatility Crush Strategy - Best for Options Traders

The Volatility Crush strategy is used with stocks that typically experience relatively low-to-moderate price moves (≤4%) following their Earnings Announcements (EA). The basic trade idea is to sell put or call options right before the EA, collecting a credit when options premium is very high due to elevated implied volatility (IV). You then close the position right after the EA by buying the option back much cheaper due to the significant drop in IV that occurs after the mystery of the EA disappears. In assessing this trade, you need to do your homework to ensure you collect sufficient premium to make the trade worthwhile.

This trade is practical due to the low-to-moderate price-move after the EA, which generally won’t significantly affect the options price, unlike an “action” stock, which experience great price moves post-EA. With these symbols, if you’re on the right side of the price move, that’s a great thing. But if you’re on the wrong side of the move, not so great. Consequently, by minimizing the effect of the post-EA price move, you have a much better chance to profit from the reduction in IV without it being ruined by a violent price move.

For this trade, open the position either (1) the night before the EA when the company announces earnings or (2) during the EA day when it announces post-market, generally capturing IV at or close to its peak.

For this trade, open the position either (1) the night before the EA when the company announces earnings or (2) during the EA day when it announces post-market, generally capturing IV at or close to its peak.

This popular stockearnings screen will give you a list of stocks which do not react more than 4% fpost-EA. It includes only those stocks whose earnings are releasing next day.

Screen criteria:

  1. Earnings Date Start Date : Current Date + 1
  2. Earnings Date End Date : Current Date + 1
  3. Predicted Move (Next Day) Max : 4%
  4. Options Type: Weekly

Strategy Guideline:

  1. Options Strategy: Sell Call and Put
  2. Options Strike Price: Current Stock Price – (% Predicated Move x 2)
  3. Expiration Date: It should generally be the closest expiry immediately after the EA.
  4. Buy Insurance: Buying back Call and Put at Strike price which 10% lower than Sell Strike Price is optional but recommended.

Watch Video for More Detail

Volatility Rush Strategy - Best for Options Traders

The Volatility Rush takes advantage of increasing options premiums into earnings announcements (EA) caused by an anticipated rise in Implied Volatility (IV). With this strategy, Buy a Call and Put at-the-money (a long straddle) 2-3 weeks before the EA when IV is lower. Sell the position either (1) the night before the EA when the company announces earnings pre-market, or (2) during the EA day when it announces post-market, generally capturing IV at or close to its peak.

This popular screen will give you a list of stocks whose Options premiums tend to rise into Earnings. It includes only those stocks whose Earnings are at least two weeks away from today.

Screen criteria:

  1. Earnings Date Start Date : Current Date + 15 Days
  2. Earnings Date End Date : Current Date + 30 Days
  3. Predicted Move (Next Day) Min : 5%
  4. Options Type: Weekly or Monthly if that lines up with the two to three-week lead-time for entering the trade

Strategy Guideline:

  1. Buy a Straddle at or close to the money two to three weeks pre-EA.
  2. Sell the position either the night before the EA when the company announces earnings pre-market, or during the EA day when it announces post-market.
  3. Expiration date should generally be the closest expiry immediately after the EA.
  4. Straddle price should not be more 60% of predicted move.

Predicted Move (Volatility)

Similar to Implied Volatility in Options. Expected volatility % based on our Proprietary Volatility Predication Model. We are expecting that stock price will likely to reach % in either direction by the end of next trading session after Earnings are released and not necessarily the closing volatility %.

Why is it important?

    This indicator helps

  1. Knowing expected volatility in stocks after Earnings helps to decide trading stocks before Earnings Announcement.
  2. Taking Advantage of volatility collapse following Earnings Results by using Advance Options strategies such as Spread and Straddles.

Since Last Earnings

Change in share price since last Earnings release.

Why is it Important?

When share has gained more than 10% since it's last Earning release, it tends to over react to minor bad news and give up some gains if not all. So, it contains more downside volatility than upside When share has dropped more than 10% since it's last Earning release, it tends to over react to minor good news and recover some drops if not all. So, it contains more upside volatility than downside.

EPS Surprise (%)

Occurs when a company's reported quarterly or annual profits are above or below analysts' expectations. Here is the formula to derive % EPS Surprice:

Actual EPS - Estimated EPS
------------------------------------- x 100
Estimated EPS

Why is it Important?

Earnings surprises can have a huge impact on a company's stock price. Several studies suggest that positive earnings surprises not only lead to an immediate hike in a stock's price, but also to a gradual increase over time. Hence, it's not surprising that some companies are known for routinely beating earning projections. A negative earnings surprise will usually result in a decline in share price.

Next Day Price Change (%)

Next Regular trading session Closing price following Earnings result.

For After Market Close Earnings, It is a next trading day closing price. For Before Market Open Earnings, It is the same trading day closing price.

Why is it Important?

Next Day price change is a reaction of Earnings result.

$100 Oil Is Becoming A Corporate Margin Problem, Not Just An Energy Shock

Posted on Sep 15, 2026 by Grayson Cavern

$100 Oil Is Becoming A Corporate Margin Problem, Not Just An Energy Shock

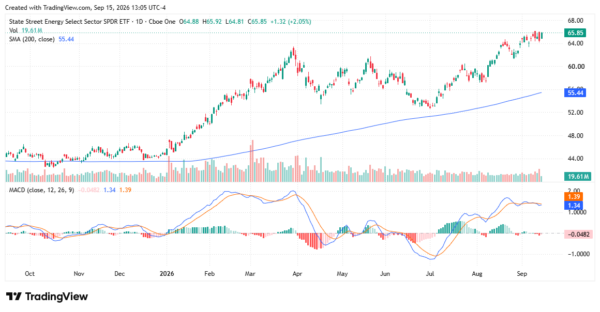
Oil crossing $100 a barrel is easy to understand as an energy story, but the mistake is when investors stop there because the critical question is what happens after that barrel enters the American economy, where some companies can pass the cost through, some benefit from it, and others have no choice but to absorb it.

Now more than ever, the supply threat is becoming harder to dismiss. Houthi forces have advanced around the Bab el-Mandeb, threatening one of the world’s most important shipping routes, while Saudi Arabia shut its East-West pipeline after an attack, removing an alternative route for moving crude around the Strait of Hormuz.

Brent reached $105.89 a barrel on September 15, while WTI climbed to $102.29 as the supply disruptions intensified. Now the oil shock is reaching the companies that actually have to live with it.

The First Group Can Pass The Cost Through


There is a big difference between using a lot of fuel and being able to charge somebody else for it. Take FedEx Corp. (NYSE: FDX). Its fuel-surcharge system adjusts with fuel prices, giving the company a mechanism to recover part of the increase from customers rather than absorbing the entire shock itself. 

United Parcel Service Inc. (NYSE: UPS) has the same advantage, with higher fuel-surcharge collections flowing through its results as fuel costs rise.  This is why I don’t want to classify every transportation company as an oil loser.

The question is whether the pricing mechanism moves fast enough, covers the incremental expense and survives customer resistance. A business with contractual pass-through can turn an oil shock into a volume problem rather than a direct margin disaster.

Companies That Want $100 Oil

For producers, higher crude prices can flow directly into revenue. But refiners deserve just as much attention because the real opportunity isn’t simply Brent. It is the spread between crude and the refined products customers need.

That is where Valero Energy Corp. (NYSE: VLO), Phillips 66 (NYSE: PSX), PBF Energy Inc. (NYSE: PBF) and HF Sinclair Corp. (NYSE: DINO) become interesting. HF Sinclair demonstrated the potential during the latest refining rebound as stronger crack spreads helped its refining business recover. The point isn’t that every refiner automatically wins when crude rises. It is that the crack spread matters more than Brent by itself. If crude is $100 because supply is constrained, while refined products remain even tighter, refiners can capture the difference.

So I wouldn’t blindly buy energy because crude crossed $100. I’d look for companies whose earnings are actually leveraged to the part of the energy market becoming scarce.

The Third Group Has To Eat It

This is where $100 oil becomes a corporate-profit story. Airlines are the cleanest example because fuel is one of their largest costs, and they don’t have unlimited pricing power. The International Air Transport Association expects fuel to represent 31.4% of airline operating expenses in 2026, up from 25.4% in 2025, while industry net margins are projected at just 2%. That is a brutal combination.

Airlines can raise fares, but customers can postpone trips, switch carriers or decide the ticket isn’t worth the price. Higher fuel, therefore, doesn’t automatically translate into higher revenue; some of the increase can simply disappear into the margin.

In the same context, retailers face a similar problem. Walmart Inc. (NYSE: WMT) saw rising fuel costs reduce first-quarter operating income by $175 million as higher energy prices increased delivery costs. This is the distinction I want investors to make. A company can increase prices and still lose margin if customers push back, volumes decline, or competitors refuse to follow.

The Oil Shock Hasn’t Fully Hit EPS Yet

The stock-market opportunity becomes clearer here. Barclays raised its 2026 S&P 500 EPS forecast to $365 from $337 on September 9, while 86% of the 492 S&P 500 companies that had reported second-quarter results were beating analyst estimates, according to LSEG data cited by Reuters. 

So the oil shock has not yet been fully translated into the earnings outlook. The first thing I would watch is forward EPS revisions, because that’s where a sustained commodity spike becomes an equity-market problem.

Then I would watch the diesel crack spread. Crude tells me what the raw commodity costs. Refined-product spreads tell me whether the shortage is becoming more severe downstream.

Freight rates and fuel surcharges come next because they show how quickly higher diesel costs are moving through the supply chain.

And then there are Treasury yields. The 10-year Treasury yield moved above 5% on September 14 and reached roughly 5.04% on September 15, its highest level since 2007, as rising oil prices reinforced inflation and rate-hike expectations.  That gives corporate America a nasty combination of higher input costs and higher financing costs.

But there is one final signal I care about most: corporate guidance.

Consider this: oil can trade above $100 for a few days without changing a company’s annual earnings.

If it stays there long enough to appear in the next earnings call, management has to tell investors whether it is raising prices, absorbing the increase, cutting costs or reducing guidance. That’s when the oil shock stops being a commodity story and becomes an earnings story.

I won’t buy energy simply because Brent is above $100. The best play is to find out where that $100 barrel goes after it leaves the oil market, because that’s where the next corporate margin pressure – and the next earnings revisions – will come from.
oil - StockEarnings

Join over 1.2M+ investors/traders who receive daily and weekly notable earnings alerts with predicted move
