ajax loader

Loading...


Ride-the-Wave Strategy – Best for Stock Traders

Ride-the-Wave targets multi-day price momentum following a company’s earnings announcement (EA). With this strategy:

  1. Buy a stock one day post-EA if a stock reacts positively post-earnings:
    1. Near the close of trading the EA-day for a pre-market-EA
    2. Near the close of the following day for a post-market-EA
  2. Sell-to-close after 7-10 days, or possibly earlier if a desired price target is reached

Similarly,

  1. short a stock one day post-EA if a stock reacts negatively post-earnings:
    1. near the close of trading the EA-day for a premarket-EA
    2. near the close of the following day for a post-market-EA
  2. then buy-to-close after 7-10 days, or possibly earlier if a desired price target is reached

Important: Ride-the-Wave is predicated on significant price momentum triggered by an EA. The 7-10 day scenario is the maximum trade hold-time. If you see post EA-momentum is halted or reversed by a significant opposite move, re-evaluate your presence in the trade.

This popular StockEarnings screen below will give you a list of stocks that historically exhibit significant price momentum following an EA for the next seven days:

  1. Stocks exhibiting positive post-EA price moves are buy-candidates
  2. Stocks exhibiting negative post-EA price moves are sell/short-candidates

The screen includes those stocks whose Earnings just came out in last two days.

Screen criteria:

  1. Earnings Date Start Date : Current Date + -1 Day
  2. Earnings Date End Date : Current Date + -2 Days
  3. Predicted Move (Next Day) Max : 7%
  4. Predicted Move (On 7th Day) Min : 7%

Strategy Guideline:

  1. Buy the stock if stock has reacted positively. Short the stock if stock has reacted negatively (see above).
  2. Close the position in 7-10 days, or possibly earlier based on price move.

Volatility Crush Strategy - Best for Options Traders

The Volatility Crush strategy is used with stocks that typically experience relatively low-to-moderate price moves (≤4%) following their Earnings Announcements (EA). The basic trade idea is to sell put or call options right before the EA, collecting a credit when options premium is very high due to elevated implied volatility (IV). You then close the position right after the EA by buying the option back much cheaper due to the significant drop in IV that occurs after the mystery of the EA disappears. In assessing this trade, you need to do your homework to ensure you collect sufficient premium to make the trade worthwhile.

This trade is practical due to the low-to-moderate price-move after the EA, which generally won’t significantly affect the options price, unlike an “action” stock, which experience great price moves post-EA. With these symbols, if you’re on the right side of the price move, that’s a great thing. But if you’re on the wrong side of the move, not so great. Consequently, by minimizing the effect of the post-EA price move, you have a much better chance to profit from the reduction in IV without it being ruined by a violent price move.

For this trade, open the position either (1) the night before the EA when the company announces earnings or (2) during the EA day when it announces post-market, generally capturing IV at or close to its peak.

For this trade, open the position either (1) the night before the EA when the company announces earnings or (2) during the EA day when it announces post-market, generally capturing IV at or close to its peak.

This popular stockearnings screen will give you a list of stocks which do not react more than 4% fpost-EA. It includes only those stocks whose earnings are releasing next day.

Screen criteria:

  1. Earnings Date Start Date : Current Date + 1
  2. Earnings Date End Date : Current Date + 1
  3. Predicted Move (Next Day) Max : 4%
  4. Options Type: Weekly

Strategy Guideline:

  1. Options Strategy: Sell Call and Put
  2. Options Strike Price: Current Stock Price – (% Predicated Move x 2)
  3. Expiration Date: It should generally be the closest expiry immediately after the EA.
  4. Buy Insurance: Buying back Call and Put at Strike price which 10% lower than Sell Strike Price is optional but recommended.

Watch Video for More Detail

Volatility Rush Strategy - Best for Options Traders

The Volatility Rush takes advantage of increasing options premiums into earnings announcements (EA) caused by an anticipated rise in Implied Volatility (IV). With this strategy, Buy a Call and Put at-the-money (a long straddle) 2-3 weeks before the EA when IV is lower. Sell the position either (1) the night before the EA when the company announces earnings pre-market, or (2) during the EA day when it announces post-market, generally capturing IV at or close to its peak.

This popular screen will give you a list of stocks whose Options premiums tend to rise into Earnings. It includes only those stocks whose Earnings are at least two weeks away from today.

Screen criteria:

  1. Earnings Date Start Date : Current Date + 15 Days
  2. Earnings Date End Date : Current Date + 30 Days
  3. Predicted Move (Next Day) Min : 5%
  4. Options Type: Weekly or Monthly if that lines up with the two to three-week lead-time for entering the trade

Strategy Guideline:

  1. Buy a Straddle at or close to the money two to three weeks pre-EA.
  2. Sell the position either the night before the EA when the company announces earnings pre-market, or during the EA day when it announces post-market.
  3. Expiration date should generally be the closest expiry immediately after the EA.
  4. Straddle price should not be more 60% of predicted move.

Predicted Move (Volatility)

Similar to Implied Volatility in Options. Expected volatility % based on our Proprietary Volatility Predication Model. We are expecting that stock price will likely to reach % in either direction by the end of next trading session after Earnings are released and not necessarily the closing volatility %.

Why is it important?

    This indicator helps

  1. Knowing expected volatility in stocks after Earnings helps to decide trading stocks before Earnings Announcement.
  2. Taking Advantage of volatility collapse following Earnings Results by using Advance Options strategies such as Spread and Straddles.

Since Last Earnings

Change in share price since last Earnings release.

Why is it Important?

When share has gained more than 10% since it's last Earning release, it tends to over react to minor bad news and give up some gains if not all. So, it contains more downside volatility than upside When share has dropped more than 10% since it's last Earning release, it tends to over react to minor good news and recover some drops if not all. So, it contains more upside volatility than downside.

EPS Surprise (%)

Occurs when a company's reported quarterly or annual profits are above or below analysts' expectations. Here is the formula to derive % EPS Surprice:

Actual EPS - Estimated EPS
------------------------------------- x 100
Estimated EPS

Why is it Important?

Earnings surprises can have a huge impact on a company's stock price. Several studies suggest that positive earnings surprises not only lead to an immediate hike in a stock's price, but also to a gradual increase over time. Hence, it's not surprising that some companies are known for routinely beating earning projections. A negative earnings surprise will usually result in a decline in share price.

Next Day Price Change (%)

Next Regular trading session Closing price following Earnings result.

For After Market Close Earnings, It is a next trading day closing price. For Before Market Open Earnings, It is the same trading day closing price.

Why is it Important?

Next Day price change is a reaction of Earnings result.

Beaten Down Broadcom (AVGO) Stock May Offer Contrarians a Discount Bounce

Posted on Sep 15, 2026 by Joshua Enomoto

Beaten Down Broadcom (AVGO) Stock May Offer Contrarians a Discount Bounce

At a cursory glance, Broadcom (NASDAQ: AVGO) doesn’t seem particularly attractive for long-side debit options traders. Down more than 13% in the trailing month, AVGO’s equity loss alone is painful. Factor in the leverage of derivative contracts, and absorbing such red ink becomes even more ghastly. Still, if the ticker’s history is any indicator, the current malaise may translate into a contrarian opportunity.

It comes down to the commonly accepted concept of mean reversion. Basically, when a top-tier security like AVGO stock stumbles, the assumption is that the corrective pressure will eventually die down. Once enough weak hands are flushed out of the system, the bulls may move in, thus driving the ticker higher to at least the previously established baseline — perhaps even beyond.

However, much of this reasoning in the financial publication sector often comes down to author intuition or vibes. Don’t get me wrong — vibes can occasionally produce “correct” answers. But such a broadly subjective worldview lacks discriminatory power. If the author was always going to declare a bullish sentiment no matter what, this methodology doesn’t distinguish from when the opportunity might be bearish.

No, I prefer an empirical approach. While I don’t deny the presupposition of mean reversion, I want the claim to be grounded in reality rather than emotion. One way we can better infer a future outcome for Broadcom stock is to deploy Markov chains. But before we go there, we need to understand what the game of probabilities is all about.

AVGO Stock and the Random Walk Theory


As a basic standard, the probabilistic implications of where an optionable public security could finish at expiration is derived by the Black-Scholes family of calculations. Undergirding this model is the presupposition that the target ticker — Broadcom stock in this case — will undergo a random walk between now and the selected expiration date.

Further, the volatility input (meaning the implied volatility or IV, which is generated from actual orders) is integrated into the framework and stays constant throughout the journey to the expiration date. As such, Black-Scholes assumes a random, risk-neutral environment.

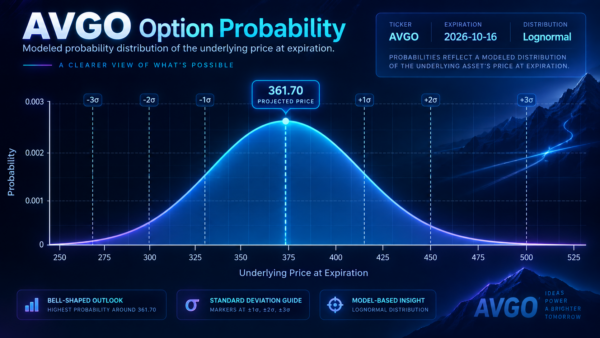
To get a basic understanding of the likelihood of AVGO stock hitting a particular terminal price at expiration, you may consult OptionCharts.io, which is a free resource that is incredibly useful for retail traders. Perhaps most notably, the resource’s Probability Distribution screener lays the basic groundwork for projected expectations.
avgo - StockEarnings

It’s an intuitive image. The center of the distribution represents the region the model considers most plausible. As you move farther into either tail, the modeled outcomes become progressively less probable.

This is all basic stuff, and you probably assumed the implications by instinct. From the long side, the further away the target price is from the current spot price, the more incrementally difficult it will be to hit by the selected expiration date.

However, this projected trend presupposes that distance to spot is the core driver of market probabilities. Further, because Black-Scholes assumes stochasticity in its formula, whatever inputs that are plugged in at the onset will always visually lead to the same graphical structure (i.e., a standard bell curve). That necessarily means that under this construct, the future is independent of the past.

In other words, it doesn’t matter if AVGO stock incurred…

  • five consecutive up weeks,
  • a 20% collapse followed by a recovery,
  • unusually strong momentum,
  • a volatility shock,
  • some specific sequence of returns.

Black-Scholes will always spit out a bell-curve-shaped probability distribution. Personally, I don’t find this presupposition convincing, which is why I turn to Markov chains.

The Future of Broadcom Stock Depends on the Current State

Under the probabilistic axiom of Russian scientist and mathematician Andrey Markov, the future state of a system depends on the current state. The defining feature of the Markov axiom is that the next link in the series of sequences depends only on the current state, not the entire earlier chain.

There is a key distinction, though, that often confuses newcomers. Markov does not necessarily mean “ignores the past.” It means “whatever past information matters has been compressed into the present state.”

From this axiom, we arrive at the key conclusion that makes Markov chains — and simulations based on this principle — tick: the future is dependent on the relative past.
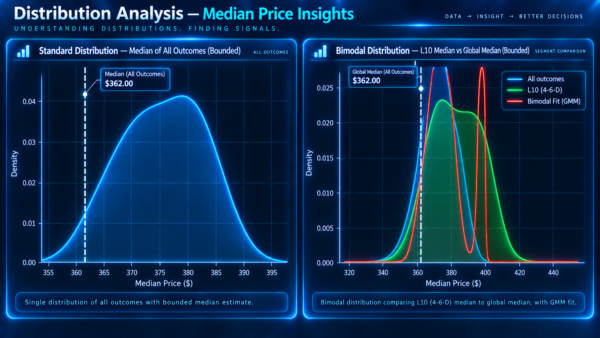
avgo - StockEarnings

That matters for AVGO stock because we’re not just trying to calculate its probabilistic trajectory “as is” like Black-Scholes is effectively doing. Instead, to better infer where it might go over the next several weeks, we need to understand what happened to AVGO in the previous several weeks.

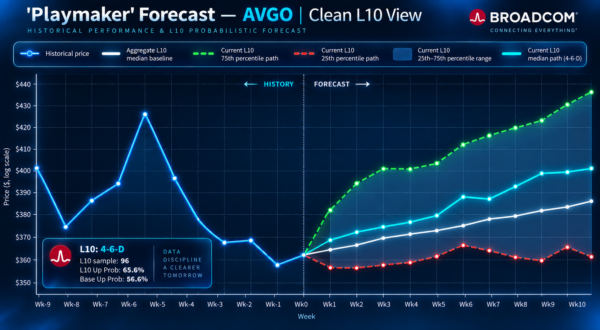
Specifically, for the last 10 weekly candlesticks, six of them were in the red, leading to a downward slope across the period. Said differently, 60% of the defined time period resulted in bearish trades. Moving forward, the assumption is that Broadcom stock may mean-revert if a good portion of the weak hands have been flushed out.
avgo - StockEarnings

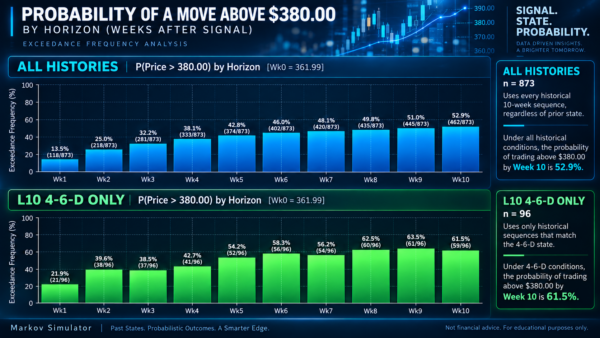
But how do we know that this flushing has occurred? That’s where we run a Markov simulation. We know that since its public market debut, AVGO stock flashed this 4-6-D sequence a total of 96 times. On the fifth week following the signal (which corresponds with the Oct. 16 expiration date), AVGO has hit the equivalent of the $380 price point 52 times or a success ratio of 54.2%.

Now, it’s time to do some comparative calculations.

Identifying an Intriguing Vertical Spread

One idea to potentially take advantage of this upward trend in Broadcom stock is the 370/380 bull call spread expiring Oct. 16. For a net debit of $440, traders will be hoping that AVGO triggers the $380 second-leg strike price at expiration. If it does, the maximum profit would be $560, a payout of over 127%.

While this trade sounds enticing on paper, bear in mind that Wall Street assigns a probability of 37.6% to trigger the breakeven threshold of $374.40 at expiration. To hit $380 proper on Oct. 16, the odds slip to a very modest 31.25%.
avgo - StockEarnings

Just to reiterate, my Markov simulation provides a probability of full profitability of 54.2%. To break even, the odds improve to 61.5%. That means out of 96 times that the 4-6-D signal flashed, AVGO stock hit the threshold 59 times.

Now, the question is, who’s right? It’s here that we all have to be honest with ourselves. Anytime we make a forecast about the unknown future, we have to start with a presupposition. I’m presupposing nonrandom behavior following an extended bearish streak. Wall Street is presupposing a random walk.

As a final defense, most of us generally believe that the equities market is nonrandom — otherwise, what would be the point of reading financial articles looking for an edge? All I’m really saying is this: if you believe in nonrandom price discovery, why would you depend on a random model?


Joshua Enomoto is a seasoned financial writer with a strong track record of in-depth stock analysis, offering clear, insightful commentary for retail investors across all levels of expertise. Renowned for his ability to blend analytical rigor with engaging wit, Joshua's work has been featured on leading investment platforms, including TipRanks, InvestorPlace, Barchart, Benzinga, and Fintel. He was also handpicked to spearhead high-impact initiatives such as InvestorPlace's "Trade of the Day" and Benzinga’s ETF coverage. As a frequent guest expert for CGTN America, Joshua discusses a wide range of economic, societal, and consumer market trends. A graduate of U.C. San Diego, Joshua brings a thoughtful and fresh perspective to complex financial narratives, helping enterprise clients connect with their audiences. He also composes music in his spare time.

Join over 1.2M+ investors/traders who receive daily and weekly notable earnings alerts with predicted move