Thanks to its pivot toward artificial intelligence and other novel technologies, International Business Machines (NYSE: IBM) finally looks more interesting to market participants whose interests lie beyond accruing dividends. Sure, IBM stock is a reliable name to park your money, but it really hasn’t been a consistently great options trade.
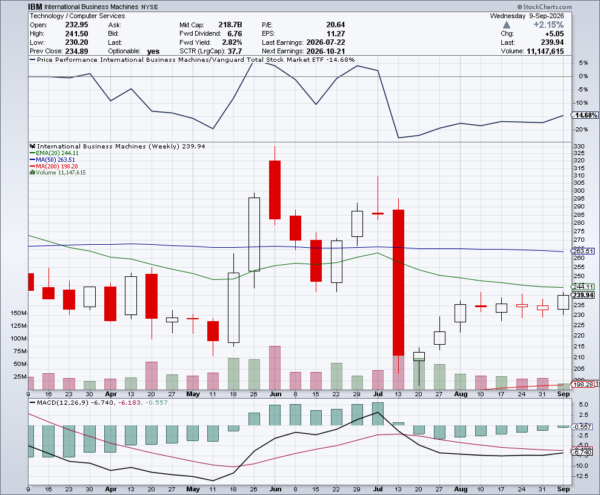
Further, debit-side traders on the bullish side of the equation found that out the hard way back in July, when IBM stock tanked hard due to less-than-ideal financial figures. The red ink turned out to be a contrarian opportunity, but that doesn’t take away from the fact that many investors have struggled with Big Blue. Subsequently, IBM finds itself down 19% on a year-to-date basis.
Overall, the fundamental argument appears rather deadlocked. According to Google Finance’s summary sheet, the bear case centers on structural drag and valuation concerns. Because enterprise spending on discretionary IT projects remains highly cyclical, IBM stock is potentially vulnerable to the downwind effects of high interest rates and broader macroeconomic pressures.
Further, if Big Blue’s generative AI bookings fail to translate into accelerating, GAAP-profitable revenue growth quickly enough, IBM stock risks multiple compression from investors expecting high-growth tech valuation tiers. Again, we saw an example of such compression just a few months ago, one that was shockingly violent.
At the same time, the good news is that there’s genuine traction in the enterprise AI and hybrid cloud businesses. As Google Finance points out, IBM has successfully commercialized its WatsonX AI platform, continuously expanding its multi-billion-dollar generative AI business and consulting pipelines as enterprises seek tailored, secure large language model (LLM) deployments.
 Source: StockCharts.com
Plus, despite the setbacks, the legacy tech giant remains a financial fortress. In particular, the company maintains exceptional free cash flow generation, protecting its robust dividend yield and providing the balance sheet capacity to fund strategic bolt-on acquisitions.
What might actually break this deadlock is a unique quantitative signal that just materialized in the charts.
An Unusual Order Flow Sets Up Possibilities for IBM Stock
While the overall technical performance this year hasn’t been all that encouraging for IBM stock, its recent print has pleasantly raised eyebrows. During the Sep. 9 session, the ticker popped up 3.38%. Over the trailing five sessions, the security has gained nearly 3%. Is something special brewing for the tech giant?
I don’t want to get ahead of myself, but IBM stock did, in fact, print an extremely rare signal; it just doesn’t look like it because it’s hiding in plain sight.
In the last 10 weeks, IBM stock has managed to print seven positive weekly candlesticks. That by itself isn’t particularly remarkable — blue chips often go on consistent runs of small but bullish sequences. However, the overall slope during these last 10 weeks has been negative, which is truly rare.
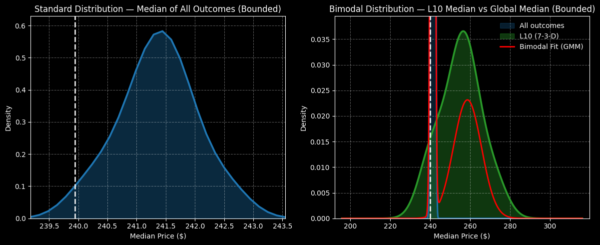
How so, you might ask? This 7-3-D (7 up weeks, 3 down weeks, downward slope) quantitative sequence has only materialized eight times on a rolling basis since January 2009. During this period, there have been a total of 904 rolling 10-week sequences, which means that this signal only comprises 0.88% of identifiable quant structures.
Obviously, we’re talking about an extremely small — and scientifically negligible — sample size. It’s not something that you would trust your life savings with. But based on the inductive implications, the median expectation for IBM stock is for the ticker to rise about 7.53% on week 6 (roughly corresponding to the Oct. 16 expiration date at time of writing).
For those who want to take a stab at this high-risk opportunity, one idea is to consider the 245/250 bull call spread expiring Oct. 16. For a net debit of $240, speculators will be hoping that IBM stock rises through the $250 second-leg strike at expiration. If it does, the maximum profit would be $260, a payout of over 108%.
While this might seem like an enticing trade, there’s a catch: Wall Street doesn’t view success as very likely.
Examining the Standard Presupposition of Big Blue
Right now, the market assigns a breakeven price for the 245/250 bull spread of $247.40. The problem with that is the probability of triggering this level at expiration. Standard options pricing models project that the odds are only 39.4%, which is not great.
Making matters more challenging for debit-side traders, OptionCharts’ Probability Distribution screener — a free resource that every trader should use — defines the probability of full profitability (triggering $250) at only 33.64%. You can see the problem here.
Basically, if you perform an expected value (EV) calculation, executing this exact trade across multiple parallel universes would see you blow up your portfolio. You would only win a little over a third of the time and only break even less than 40% of the time.
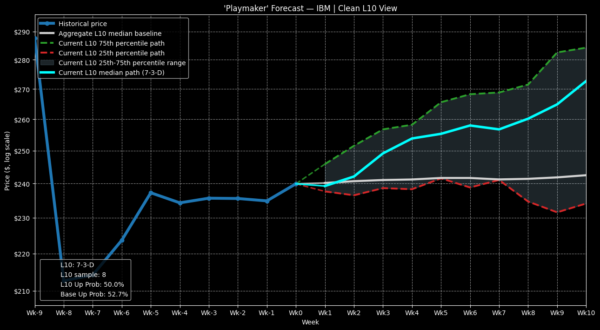
Unless you happen to catch an unusual wave of persistently good fortune, you’re going to be in the hole financially. Still, you should always ask the meta question: where did these probabilities even come from?
To make a long story short, Wall Street is pricing IBM stock options as if the underlying security will undergo a random walk between now and the expiration date, with the current implied volatility (IV) serving as a constant “fuel” throughout the journey. Subsequently, randomness and risk-neutrality represent the core drivers of this artificial framework.
But that’s the whole point of this presupposition: it’s entirely artificial. Personally, I believe that IBM stock will undergo a nonrandom walk. That’s largely because of the rare 7-3-D sequence. Despite productive technical work, Big Blue still finds itself suffering from a downward slope in the past two months.
So what, you might ask? Well, institutional contrarians may still view IBM stock as a discounted opportunity. That perception would imply a nonrandom expectation as such traders would be reacting to a perceived discounted dynamic.
Every Future Forecast is a Presupposition
While I might be critical of the Street’s presupposition, it’s not that anyone in the forecasting game is without presuppositions. I have my own too. Primarily, though, the difference is that my presupposition is consistent with my beliefs.
Generally, it’s fair to say that most people believe the equities market is nonrandom. If it were truly random like a coin toss, there would be no reason to read about investing and trading ideas. No matter what you read, the outcome will be 50/50. But you don’t think that way; you believe that there’s an edge to be extracted — that’s nonrandom behavior.
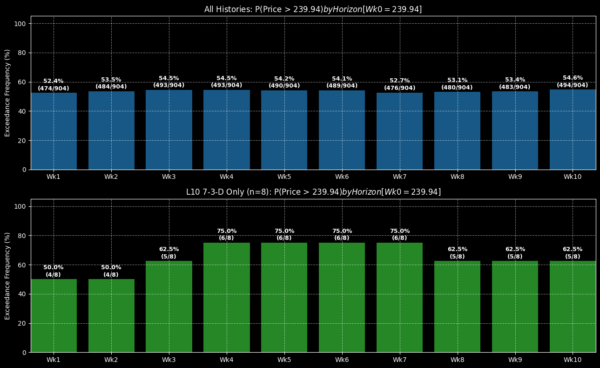
Therefore, if you believe in nonrandomness, why are you depending on random frameworks to formulate your decisions? You should also use a nonrandom model, which is what I’m doing here.
If you want to know more about this topic, I’m building an educational YouTube channel called the Markov Simulator. For those who are just interested in a specific trading idea, IBM stock may be worth consideration.

