ajax loader

Loading...


Ride-the-Wave Strategy – Best for Stock Traders

Ride-the-Wave targets multi-day price momentum following a company’s earnings announcement (EA). With this strategy:

  1. Buy a stock one day post-EA if a stock reacts positively post-earnings:
    1. Near the close of trading the EA-day for a pre-market-EA
    2. Near the close of the following day for a post-market-EA
  2. Sell-to-close after 7-10 days, or possibly earlier if a desired price target is reached

Similarly,

  1. short a stock one day post-EA if a stock reacts negatively post-earnings:
    1. near the close of trading the EA-day for a premarket-EA
    2. near the close of the following day for a post-market-EA
  2. then buy-to-close after 7-10 days, or possibly earlier if a desired price target is reached

Important: Ride-the-Wave is predicated on significant price momentum triggered by an EA. The 7-10 day scenario is the maximum trade hold-time. If you see post EA-momentum is halted or reversed by a significant opposite move, re-evaluate your presence in the trade.

This popular StockEarnings screen below will give you a list of stocks that historically exhibit significant price momentum following an EA for the next seven days:

  1. Stocks exhibiting positive post-EA price moves are buy-candidates
  2. Stocks exhibiting negative post-EA price moves are sell/short-candidates

The screen includes those stocks whose Earnings just came out in last two days.

Screen criteria:

  1. Earnings Date Start Date : Current Date + -1 Day
  2. Earnings Date End Date : Current Date + -2 Days
  3. Predicted Move (Next Day) Max : 7%
  4. Predicted Move (On 7th Day) Min : 7%

Strategy Guideline:

  1. Buy the stock if stock has reacted positively. Short the stock if stock has reacted negatively (see above).
  2. Close the position in 7-10 days, or possibly earlier based on price move.

Volatility Crush Strategy - Best for Options Traders

The Volatility Crush strategy is used with stocks that typically experience relatively low-to-moderate price moves (≤4%) following their Earnings Announcements (EA). The basic trade idea is to sell put or call options right before the EA, collecting a credit when options premium is very high due to elevated implied volatility (IV). You then close the position right after the EA by buying the option back much cheaper due to the significant drop in IV that occurs after the mystery of the EA disappears. In assessing this trade, you need to do your homework to ensure you collect sufficient premium to make the trade worthwhile.

This trade is practical due to the low-to-moderate price-move after the EA, which generally won’t significantly affect the options price, unlike an “action” stock, which experience great price moves post-EA. With these symbols, if you’re on the right side of the price move, that’s a great thing. But if you’re on the wrong side of the move, not so great. Consequently, by minimizing the effect of the post-EA price move, you have a much better chance to profit from the reduction in IV without it being ruined by a violent price move.

For this trade, open the position either (1) the night before the EA when the company announces earnings or (2) during the EA day when it announces post-market, generally capturing IV at or close to its peak.

For this trade, open the position either (1) the night before the EA when the company announces earnings or (2) during the EA day when it announces post-market, generally capturing IV at or close to its peak.

This popular stockearnings screen will give you a list of stocks which do not react more than 4% fpost-EA. It includes only those stocks whose earnings are releasing next day.

Screen criteria:

  1. Earnings Date Start Date : Current Date + 1
  2. Earnings Date End Date : Current Date + 1
  3. Predicted Move (Next Day) Max : 4%
  4. Options Type: Weekly

Strategy Guideline:

  1. Options Strategy: Sell Call and Put
  2. Options Strike Price: Current Stock Price – (% Predicated Move x 2)
  3. Expiration Date: It should generally be the closest expiry immediately after the EA.
  4. Buy Insurance: Buying back Call and Put at Strike price which 10% lower than Sell Strike Price is optional but recommended.

Watch Video for More Detail

Volatility Rush Strategy - Best for Options Traders

The Volatility Rush takes advantage of increasing options premiums into earnings announcements (EA) caused by an anticipated rise in Implied Volatility (IV). With this strategy, Buy a Call and Put at-the-money (a long straddle) 2-3 weeks before the EA when IV is lower. Sell the position either (1) the night before the EA when the company announces earnings pre-market, or (2) during the EA day when it announces post-market, generally capturing IV at or close to its peak.

This popular screen will give you a list of stocks whose Options premiums tend to rise into Earnings. It includes only those stocks whose Earnings are at least two weeks away from today.

Screen criteria:

  1. Earnings Date Start Date : Current Date + 15 Days
  2. Earnings Date End Date : Current Date + 30 Days
  3. Predicted Move (Next Day) Min : 5%
  4. Options Type: Weekly or Monthly if that lines up with the two to three-week lead-time for entering the trade

Strategy Guideline:

  1. Buy a Straddle at or close to the money two to three weeks pre-EA.
  2. Sell the position either the night before the EA when the company announces earnings pre-market, or during the EA day when it announces post-market.
  3. Expiration date should generally be the closest expiry immediately after the EA.
  4. Straddle price should not be more 60% of predicted move.

Predicted Move (Volatility)

Similar to Implied Volatility in Options. Expected volatility % based on our Proprietary Volatility Predication Model. We are expecting that stock price will likely to reach % in either direction by the end of next trading session after Earnings are released and not necessarily the closing volatility %.

Why is it important?

    This indicator helps

  1. Knowing expected volatility in stocks after Earnings helps to decide trading stocks before Earnings Announcement.
  2. Taking Advantage of volatility collapse following Earnings Results by using Advance Options strategies such as Spread and Straddles.

Since Last Earnings

Change in share price since last Earnings release.

Why is it Important?

When share has gained more than 10% since it's last Earning release, it tends to over react to minor bad news and give up some gains if not all. So, it contains more downside volatility than upside When share has dropped more than 10% since it's last Earning release, it tends to over react to minor good news and recover some drops if not all. So, it contains more upside volatility than downside.

EPS Surprise (%)

Occurs when a company's reported quarterly or annual profits are above or below analysts' expectations. Here is the formula to derive % EPS Surprice:

Actual EPS - Estimated EPS
------------------------------------- x 100
Estimated EPS

Why is it Important?

Earnings surprises can have a huge impact on a company's stock price. Several studies suggest that positive earnings surprises not only lead to an immediate hike in a stock's price, but also to a gradual increase over time. Hence, it's not surprising that some companies are known for routinely beating earning projections. A negative earnings surprise will usually result in a decline in share price.

Next Day Price Change (%)

Next Regular trading session Closing price following Earnings result.

For After Market Close Earnings, It is a next trading day closing price. For Before Market Open Earnings, It is the same trading day closing price.

Why is it Important?

Next Day price change is a reaction of Earnings result.

Could a K-Shaped Earnings Recovery Warrant a Bear Spread on DAL Stock?

Posted on Jan 14, 2026 by Joshua Enomoto

Could a K-Shaped Earnings Recovery Warrant a Bear Spread on DAL Stock?

Delta Air Lines (NYSE:DAL) recently released its earnings results for the fourth quarter, delivering a mixed read that ultimately sent DAL stock lower in the open market session on Tuesday. Investors will likely take some encouragement at the carrier’s overall financial performance, though near-term options traders may be tempted to consider a bearish position — albeit only temporarily.

Regarding the print, Delta posted adjusted earnings per share of $1.55, beating out Wall Street’s consensus view of $1.53. However, on the top line, the airliner only managed to generate $14.61 billion, which missed expectations calling for $15.80 billion. Fortunately, management did have some good news to share, which may have mitigated some of the disappointment.

For the first three months of 2026, Delta has forecasted an increase in sales of as much as 7%. Further, adjusted earnings may land between 50 cents per share and 90 cents per share, well above the 72 cents per share anticipated by analysts.

Despite a mixture of data, investors took to the exits, leading to a 2.39% loss for DAL stock. As management admitted, Delta is sitting atop a so-called “K-shaped” economic recovery, meaning that top-line growth has been concentrated among higher-spending consumers. In theory, that should be a win for Delta, as travel isn’t exactly a pursuit of the underprivileged.

Unfortunately, K-shaped recoveries are also fundamentally problematic, especially in the aftermath of artificial intelligence. To make a long story short, the simultaneous productivity enhancement and the disruption of AI mean that while the K-shape’s upper arm is longer, it’s also thinner due to fewer participants.

Over time, that’s a sustainability concern — and it does seem that the market is responding to that risk. As such, there’s reason for both investors and traders to be cautious about DAL stock.

No Such Thing as Independent, Objective Truth in the Market


I’m going to share something that puts me at odds with 99% of the financial publication industry: there’s no such thing as independent, objective truth in the market. While this statement sounds nihilistic, it’s one of the most liberating concepts one can absorb. It’s also the point where, ironically enough, true knowledge of the market begins.

Invariably, if DAL stock continues on its descent, analysts will argue that the carrier is undervalued. However, you should be aware that this concept cannot be independently verified in the abstract. Undervaluation in this context only means a discount relative to an assumption, but nobody knows if that assumption will hold true or not.

Similarly, traders will turn to options-focused calculators to find Delta’s potential forward dispersion. In recent years, “expected move” calculators have grown popular in the finpub space as they supposedly provide statistical intelligence of potential kinesis. However, these calculators — and the “probability of profit” metrics that they spit out — are based on assumptions built from the Black-Scholes formula.

To be sure, the math undergirding Black-Scholes is elegantly brilliant and internally consistent. But just because a formula is elegant and consistent does not mean that it correctly describes reality. In fact, Black-Scholes is guaranteed not to be correct.

You don’t need to be a mathematical wizard to understand the key epistemological concern. Black-Scholes, of course, is Wall Street’s standard mechanism for pricing options, but it’s also a one-size-fits-all solution. So, whether you’re modeling risk for semiconductors, apparel manufacturers or airliners, the underlying derivatives are priced via this standardized formula.

When options-related content leads up to the Black-Scholes-derived probability of profit as the punchline, I can’t help but laugh. That’s where the analysis begins, not where it ends. When you embrace the non-existence of independent truth in the market, you free yourself from the presumptions of Black-Scholes or any other templated methodology.

Instead, we will let the data — the one that is specific to DAL stock — do the talking.

Finding ‘Truth’ in the Structure of DAL Stock

If a theist is ever to convincingly deliver objective evidence of a deity, it will almost certainly come in the form of a hierarchical framework. Mainly, that’s because there’s no one linear proposal — such as the fine-tuning argument — that neatly and logically concludes the existence of a higher power.

By the same logic, there’s no one financial metric that explains the behavior of a public security. That’s why fundamental, technical and even quantitative analysis should be taken with a grain of salt if the methodology is flat or single-layer. Instead, the only way that we can find “truth” — or at least as far as we can understand that concept in the market — is through hierarchical structure.

DAL stock - StockEarnings

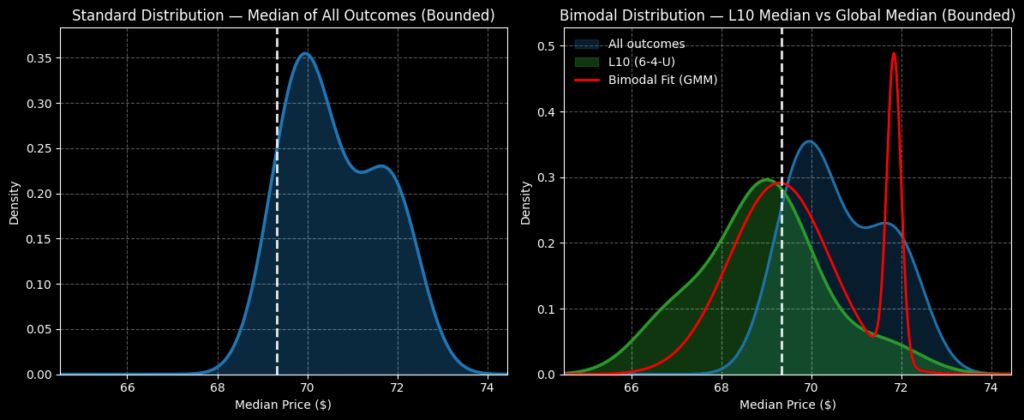
Using a dataset going back to January 2019, the forward 10-week returns of DAL stock would ordinarily land between $67 and $74 over the next 10 weeks (assuming a spot price of $69.33, Tuesday’s close). This demonstrates an upward bias as an aggregate behavior.

However, the market operates under a Markov property, meaning colloquially that the probability of tomorrow hinges on what happens today. Under a hierarchical framework, “today” can be defined as the current quantitative structure, where in the last 10 weeks, DAL stock printed six up weeks, leading to an overall upward slope.

Under 6-4-U conditions, the forward 10-week returns of DAL stock could be expected to lean slightly bearish, with outcomes expected to land between $65 and $74. Further, probability density would likely peak at just below spot, thus presenting risks for bullish traders.

What’s really interesting is that on a fixed, five-week-forward framework, DAL stock risks landing between $65 and $72. Given the adverse response to Delta’s earnings, it wouldn’t surprise me at all for a bear put spread to be in play.

Taking a Potshot Against Delta Stock

To be clear, I’m not suggesting an extended negative position against DAL stock. I do believe that over the next several weeks, Delta can regain its mojo. However, in the immediate aftermath of less-than-stellar earnings results — combined with DAL gaining a strong 19.31% in the trailing six months — the security could face some turbulent weather.

DAL stock - StockEarnings

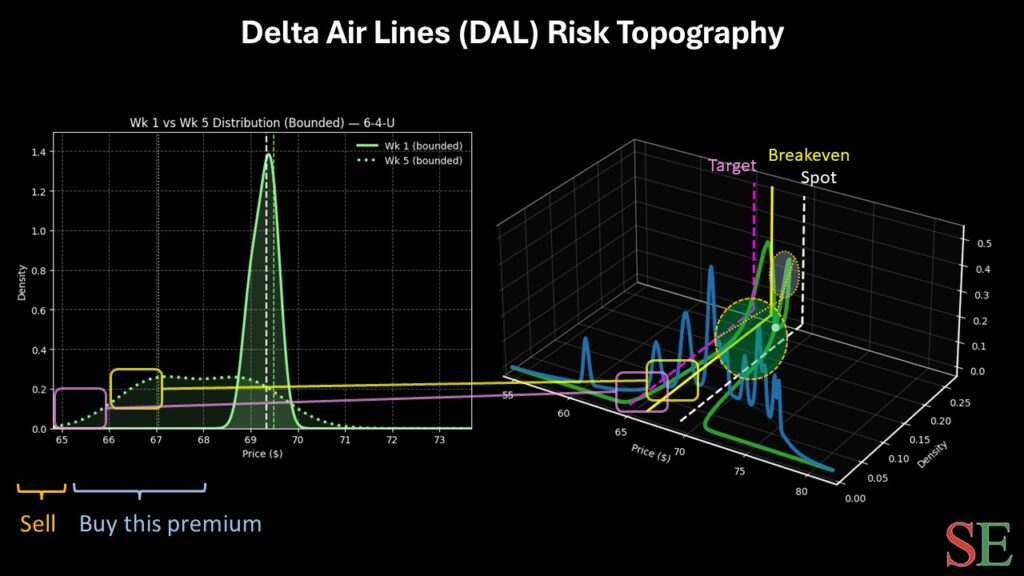
With the hierarchical analysis pointing to a downward distribution before a reversion to the mean, a bearish position could be profitable.

It’s a highly ambitious trade, but the 67.50/65 bear put spread expiring Feb. 20, 2026, may be intriguing. This trade requires a net debit of $94, which is the most that can be lost. Should DAL stock fall through the $65 strike at expiration, the maximum profit would be $156 or a payout of nearly 166%.

Joshua Enomoto is a seasoned financial writer with a strong track record of in-depth stock analysis, offering clear, insightful commentary for retail investors across all levels of expertise. Renowned for his ability to blend analytical rigor with engaging wit, Joshua's work has been featured on leading investment platforms, including TipRanks, InvestorPlace, Barchart, Benzinga, and Fintel. He was also handpicked to spearhead high-impact initiatives such as InvestorPlace's "Trade of the Day" and Benzinga’s ETF coverage. As a frequent guest expert for CGTN America, Joshua discusses a wide range of economic, societal, and consumer market trends. A graduate of U.C. San Diego, Joshua brings a thoughtful and fresh perspective to complex financial narratives, helping enterprise clients connect with their audiences. He also composes music in his spare time.

Join over 1.2M+ investors/traders who receive daily and weekly notable earnings alerts with predicted move