ajax loader

Loading...


Ride-the-Wave Strategy – Best for Stock Traders

Ride-the-Wave targets multi-day price momentum following a company’s earnings announcement (EA). With this strategy:

  1. Buy a stock one day post-EA if a stock reacts positively post-earnings:
    1. Near the close of trading the EA-day for a pre-market-EA
    2. Near the close of the following day for a post-market-EA
  2. Sell-to-close after 7-10 days, or possibly earlier if a desired price target is reached

Similarly,

  1. short a stock one day post-EA if a stock reacts negatively post-earnings:
    1. near the close of trading the EA-day for a premarket-EA
    2. near the close of the following day for a post-market-EA
  2. then buy-to-close after 7-10 days, or possibly earlier if a desired price target is reached

Important: Ride-the-Wave is predicated on significant price momentum triggered by an EA. The 7-10 day scenario is the maximum trade hold-time. If you see post EA-momentum is halted or reversed by a significant opposite move, re-evaluate your presence in the trade.

This popular StockEarnings screen below will give you a list of stocks that historically exhibit significant price momentum following an EA for the next seven days:

  1. Stocks exhibiting positive post-EA price moves are buy-candidates
  2. Stocks exhibiting negative post-EA price moves are sell/short-candidates

The screen includes those stocks whose Earnings just came out in last two days.

Screen criteria:

  1. Earnings Date Start Date : Current Date + -1 Day
  2. Earnings Date End Date : Current Date + -2 Days
  3. Predicted Move (Next Day) Max : 7%
  4. Predicted Move (On 7th Day) Min : 7%

Strategy Guideline:

  1. Buy the stock if stock has reacted positively. Short the stock if stock has reacted negatively (see above).
  2. Close the position in 7-10 days, or possibly earlier based on price move.

Volatility Crush Strategy - Best for Options Traders

The Volatility Crush strategy is used with stocks that typically experience relatively low-to-moderate price moves (≤4%) following their Earnings Announcements (EA). The basic trade idea is to sell put or call options right before the EA, collecting a credit when options premium is very high due to elevated implied volatility (IV). You then close the position right after the EA by buying the option back much cheaper due to the significant drop in IV that occurs after the mystery of the EA disappears. In assessing this trade, you need to do your homework to ensure you collect sufficient premium to make the trade worthwhile.

This trade is practical due to the low-to-moderate price-move after the EA, which generally won’t significantly affect the options price, unlike an “action” stock, which experience great price moves post-EA. With these symbols, if you’re on the right side of the price move, that’s a great thing. But if you’re on the wrong side of the move, not so great. Consequently, by minimizing the effect of the post-EA price move, you have a much better chance to profit from the reduction in IV without it being ruined by a violent price move.

For this trade, open the position either (1) the night before the EA when the company announces earnings or (2) during the EA day when it announces post-market, generally capturing IV at or close to its peak.

For this trade, open the position either (1) the night before the EA when the company announces earnings or (2) during the EA day when it announces post-market, generally capturing IV at or close to its peak.

This popular stockearnings screen will give you a list of stocks which do not react more than 4% fpost-EA. It includes only those stocks whose earnings are releasing next day.

Screen criteria:

  1. Earnings Date Start Date : Current Date + 1
  2. Earnings Date End Date : Current Date + 1
  3. Predicted Move (Next Day) Max : 4%
  4. Options Type: Weekly

Strategy Guideline:

  1. Options Strategy: Sell Call and Put
  2. Options Strike Price: Current Stock Price – (% Predicated Move x 2)
  3. Expiration Date: It should generally be the closest expiry immediately after the EA.
  4. Buy Insurance: Buying back Call and Put at Strike price which 10% lower than Sell Strike Price is optional but recommended.

Watch Video for More Detail

Volatility Rush Strategy - Best for Options Traders

The Volatility Rush takes advantage of increasing options premiums into earnings announcements (EA) caused by an anticipated rise in Implied Volatility (IV). With this strategy, Buy a Call and Put at-the-money (a long straddle) 2-3 weeks before the EA when IV is lower. Sell the position either (1) the night before the EA when the company announces earnings pre-market, or (2) during the EA day when it announces post-market, generally capturing IV at or close to its peak.

This popular screen will give you a list of stocks whose Options premiums tend to rise into Earnings. It includes only those stocks whose Earnings are at least two weeks away from today.

Screen criteria:

  1. Earnings Date Start Date : Current Date + 15 Days
  2. Earnings Date End Date : Current Date + 30 Days
  3. Predicted Move (Next Day) Min : 5%
  4. Options Type: Weekly or Monthly if that lines up with the two to three-week lead-time for entering the trade

Strategy Guideline:

  1. Buy a Straddle at or close to the money two to three weeks pre-EA.
  2. Sell the position either the night before the EA when the company announces earnings pre-market, or during the EA day when it announces post-market.
  3. Expiration date should generally be the closest expiry immediately after the EA.
  4. Straddle price should not be more 60% of predicted move.

Predicted Move (Volatility)

Similar to Implied Volatility in Options. Expected volatility % based on our Proprietary Volatility Predication Model. We are expecting that stock price will likely to reach % in either direction by the end of next trading session after Earnings are released and not necessarily the closing volatility %.

Why is it important?

    This indicator helps

  1. Knowing expected volatility in stocks after Earnings helps to decide trading stocks before Earnings Announcement.
  2. Taking Advantage of volatility collapse following Earnings Results by using Advance Options strategies such as Spread and Straddles.

Since Last Earnings

Change in share price since last Earnings release.

Why is it Important?

When share has gained more than 10% since it's last Earning release, it tends to over react to minor bad news and give up some gains if not all. So, it contains more downside volatility than upside When share has dropped more than 10% since it's last Earning release, it tends to over react to minor good news and recover some drops if not all. So, it contains more upside volatility than downside.

EPS Surprise (%)

Occurs when a company's reported quarterly or annual profits are above or below analysts' expectations. Here is the formula to derive % EPS Surprice:

Actual EPS - Estimated EPS
------------------------------------- x 100
Estimated EPS

Why is it Important?

Earnings surprises can have a huge impact on a company's stock price. Several studies suggest that positive earnings surprises not only lead to an immediate hike in a stock's price, but also to a gradual increase over time. Hence, it's not surprising that some companies are known for routinely beating earning projections. A negative earnings surprise will usually result in a decline in share price.

Next Day Price Change (%)

Next Regular trading session Closing price following Earnings result.

For After Market Close Earnings, It is a next trading day closing price. For Before Market Open Earnings, It is the same trading day closing price.

Why is it Important?

Next Day price change is a reaction of Earnings result.

EnerSys’ Flat Sales Hide a Fast-Growing Defense and Data Center Business

Posted on Nov 12, 2026 by Grayson Cavern

EnerSys’ Flat Sales Hide a Fast-Growing Defense and Data Center Business

EnerSys (NYSE: ENS) generated $949.9 million in second-quarter revenue, virtually unchanged from a year earlier. Yet adjusted operating earnings increased 13.7% to $152.4 million, while adjusted diluted EPS climbed 22% to $3.22.

The company is finding ways to earn more from its existing sales base, even as weakness in parts of its industrial business holds back revenue growth. The segment breakdown reveals where that improvement is coming from.

Data Centers And Defense Are Carrying The Growth


PPS generated $103.8 million in revenue, up 21%, while adjusted operating earnings climbed 43.2% to $22.7 million. Its adjusted operating margin reached 21.9%, compared with 18.5% a year earlier. NIS produced $449 million in revenue, up 3.3%, but adjusted operating earnings increased 38.3% to $50.1 million as its margin expanded from 8.3% to 11.2%. Management specifically cited double-digit data-center growth. 

Industrial Mobility Solutions (IMS) remains the counterweight. Revenue fell 7.8% to $397.1 million, and adjusted operating earnings dropped 13.4% to $37.5 million. Material handling is still the principal drag. Management sees early signs of recovery, but expects transportation growth to outpace higher-margin material handling next quarter, putting pressure on IMS margins. 

It’s easy to see why EnerSys is gaining ground from that contrast. PPS is converting higher sales into faster earnings growth, while NIS is generating substantially more operating profit from modest revenue growth. This means the company does not need every end market to rebound simultaneously if these businesses keep expanding.

Ultralife Could Deepen The Defense Opportunity

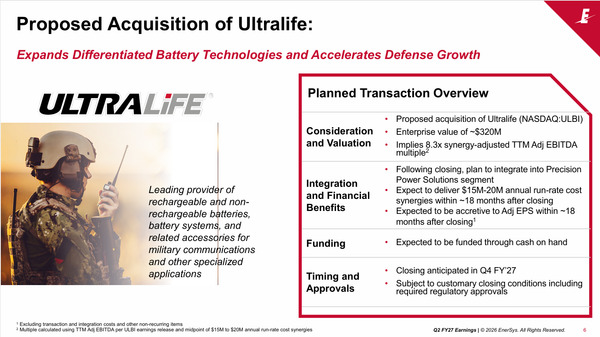
EnerSys‘ proposed acquisition of Ultralife fits the growth already emerging in PPS. Announced October 27, the transaction is intended to broaden EnerSys’ battery technologies and accelerate its position in defense markets. PPS already benefits from demand for soldier power and munitions, and Ultralife could widen the product offering and strengthen EnerSys’ ability to serve U.S. and allied military customers.

The deal remains subject to regulatory approvals and customary closing conditions, and EnerSys excluded Ultralife from Q3 guidance. And I’d treat it as potential growth, not revenue already captured.
enersys - StockEarnings

Earnings Growth Needs To Translate Into Durable Sales

Adjusted operating earnings rose 13.7% to $152.4 million, while adjusted diluted EPS increased 22% to $3.22. However, the quarter included $44.4 million of 45X manufacturing tax credits, worth approximately $0.80 per diluted share after tax. Excluding that benefit, adjusted EPS was $2.02, still 25% above the prior-year $1.61. Gross margin improved to 29.9% from 29.1%, while the margin excluding 45X edged up to 25.2% from 24.9%. Underlying improvement is real, but headline EPS includes a substantial government incentive. 

First-half cash generation improved despite a weaker quarterly comparison. Q2 operating cash flow was $142.8 million and free cash flow $130.4 million, both below the year-ago quarter, which benefited from a federal tax refund. For the first six months, operating cash flow rose to $372.8 million from $219 million, while free cash flow more than doubled to $348 million from $165.1 million. Net debt stood at $554.9 million, with leverage down to 0.8x EBITDA from 1.3x. 

EnerSys returned $140.3 million to shareholders, including $130 million in buybacks and $10.3 million in dividends. For Q3, management expects revenue of $935 million to $975 million and adjusted diluted EPS of $3.05 to $3.15, including 45X credits. Data-center and defense gains must keep widening while material handling stabilizes. 

ENS Stock Is Still Fighting Its Downtrend

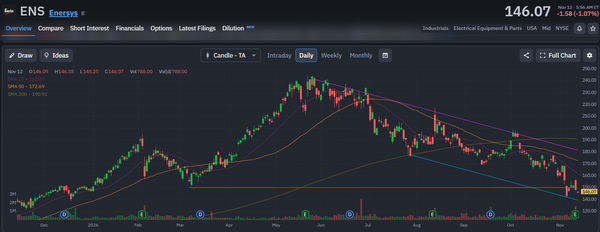
EnerSys shares have fallen to $146.07, putting them below the 20-day, 50-day and 200-day moving averages at $161.83, $172.69 and $190.91, respectively. The stock has been making lower highs since its May peak near $240, and the recent break below $150 shows sellers are still dictating the direction. The 140–145 area is now the next place to watch for buyers to step in.

A bounce from here could give ENS some much-needed relief, but I’d want to see it reclaim $150 first. The 20-day average is the next level to watch, followed by the 50-day. Getting back above those levels would give the recovery some credibility. Right now, though, ENS remains in a clear downtrend, and buyers have yet to show they can turn it around.
enersys - StockEarnings

Added To The Watchlist

EnerSys is building a stronger earnings base through data centers and defense, with Ultralife offering another potential boost. But IMS remains weak, consolidated revenue has barely grown, and 45X credits lift adjusted EPS even as the stock remains below every major moving average.

I’d keep ENS on the watchlist rather than chase it here. The operating story is improving, but the chart has not turned and management’s near-term sales outlook does not signal a breakout in consolidated demand. A sustained move above $150 would signal buyers are returning. Until then, the downtrend deserves respect.


Join over 1.2M+ investors/traders who receive daily and weekly notable earnings alerts with predicted move