When a stock has already been dragged through a 50% selloff, the conversation among investors usually changes from “What went wrong?” to “How much lower can this thing possibly go?”
That is where I start getting careful because a stock falling from $100 to $50 does not mean you are now risking $50 instead of $100. If the business deteriorates badly enough, you can still lose another $25 from here, and that is another 50% loss on the money you are putting to work today. That is exactly what I wanted to find out with Nike (NYSE: NKE), Lululemon Athletica (NASDAQ: LULU), and PayPal Holdings Inc (NASDAQ: PYPL).
Nike
Nike is the one where investors can talk themselves into the turnaround before the turnaround has actually arrived. In fact, the latest quarter 4 release made it easy, as North America revenue grew 3%, wholesale revenue rose 4%, and the company generated $11.1 billion in Q4 revenue as Elliott Hill’s attempt to rebuild the brand starts showing up in parts of the business. But much of the repair job remains unfinished.
Greater China revenue fell 17% on a currency-neutral basis, Nike Direct dropped 9%, NIKE Brand Digital fell 12%, and Converse revenue plunged 34%. Meanwhile, the headline $0.72 in Q4 EPS looked far cleaner than the underlying quarter because $0.52 came from the expected recovery of IEEPA tariffs.
That means a large part of the quarter’s earnings recovery came from money Nike expected to get back, not from the turnaround suddenly firing on every cylinder.
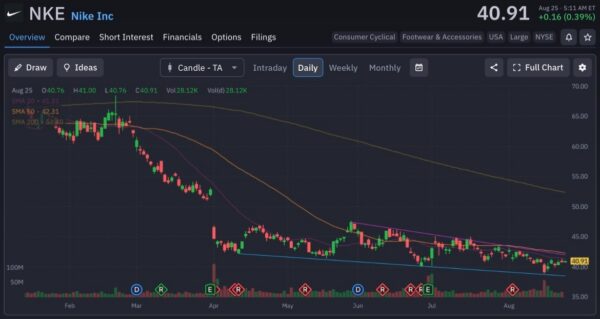
This is where investors need to separate a beaten-down stock from a finished turnaround. At $40.91, NKE sits below its 20-day SMA of $41.31, 50-day SMA of $42.31, and 200-day SMA of $52.40, with the long-term trend still pointing decisively downward.
That setup confirms the stock has stopped collapsing, but it has not proved that it can recover. But if China stays weak, digital sales keep shrinking, and the company struggles to rebuild product momentum, the market can still decide that the business is deteriorating more slowly.
So now, the risk is what if Nike needs another two or three years to become the Nike investors remember?
A stock trading around $41 can still become a $28 stock without requiring the business to collapse. It only needs the turnaround to take longer, margins to remain under pressure, and investors to grow tired of waiting for earnings to recover.
Lululemon Athletica
Lululemon latest earnings showed why a cheap stock can still carry expensive risk. First-quarter revenue grew 4% to $2.5 billion, while international revenue rose 22% and China Mainland grew 30%, giving the bulls a clear reason to believe the growth story is still alive.
The problem sits in the business investors originally paid a premium to own. Americas revenue fell 3%, comparable sales dropped 5%, gross margin contracted 410 basis points to 54.2%, and operating income plunged 37%, pushing operating margin down from 18.5% to 11.2%. Management also cut its full-year outlook, guiding revenue between a 1% decline and flat growth and reducing EPS guidance to $10.95-$11.15.
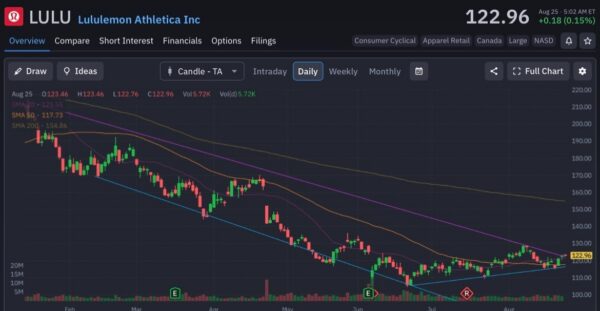
The chart shows some stabilization, but not a repaired growth story. At $122.96, LULU is sitting above its 20-day SMA of $121.55 and 50-day SMA of $117.73, yet remains far below its 200-day SMA of $154.86, with only 5.72K in volume on the latest session.
So the stock has bounced, while the bigger downtrend remains intact. At first glance, around 11 times the midpoint of management’s earnings guidance, Lululemon looks cheap. But another 30% decline to roughly $86 becomes possible if the Americas fail to recover and the market starts valuing LULU as a slower-growth apparel retailer rather than the premium growth machine it once was.
International growth is buying Lululemon time, but it has not yet fixed the part of the business investors originally fell in love with.
PayPal Holdings Inc
PayPal Holdings Inc numbers make the bull case easiest to understand and the risk hardest to dismiss. Total payment volume grew 10% to $486.4 billion, transactions increased 8%, revenue rose 5% to $8.7 billion, and the company generated $1.8 billion in free cash flow, showing that the platform is still moving an enormous and growing amount of money. But only a little of that growth is reaching the bottom line.
Transaction margin dollars grew just 1%, while GAAP operating income fell 5%, non-GAAP operating income declined 8%, and non-GAAP operating margin dropped 248 basis points to 17.4%. PayPal processed another $44 billion of payment volume in the quarter, yet the economics it retained barely moved.
That is not a small detail when the entire turnaround depends on the company proving it can grow more profitably.
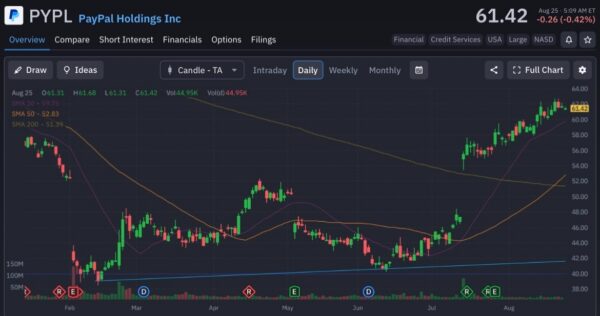
The chart, unlike Nike’s or Lululemon‘s, is showing investors exactly what a turnaround looks like before the business has fully proved it. At $61.42, PYPL trades above its 20-day SMA of $59.75, 50-day SMA of $52.83, and 200-day SMA of $41.39, after climbing from around $40 in June to above $60 in August.
So, the market is already giving PayPal credit. Using management’s full-year non-GAAP EPS outlook of approximately $5.38, the stock still trades at roughly 11 times earnings, which will keep value investors interested. But another 30% decline to around $43 does not require PayPal’s volumes to collapse – it only requires margins to keep deteriorating while investors decide the company deserves to trade like a mature payments processor rather than a growth story finding its way back.